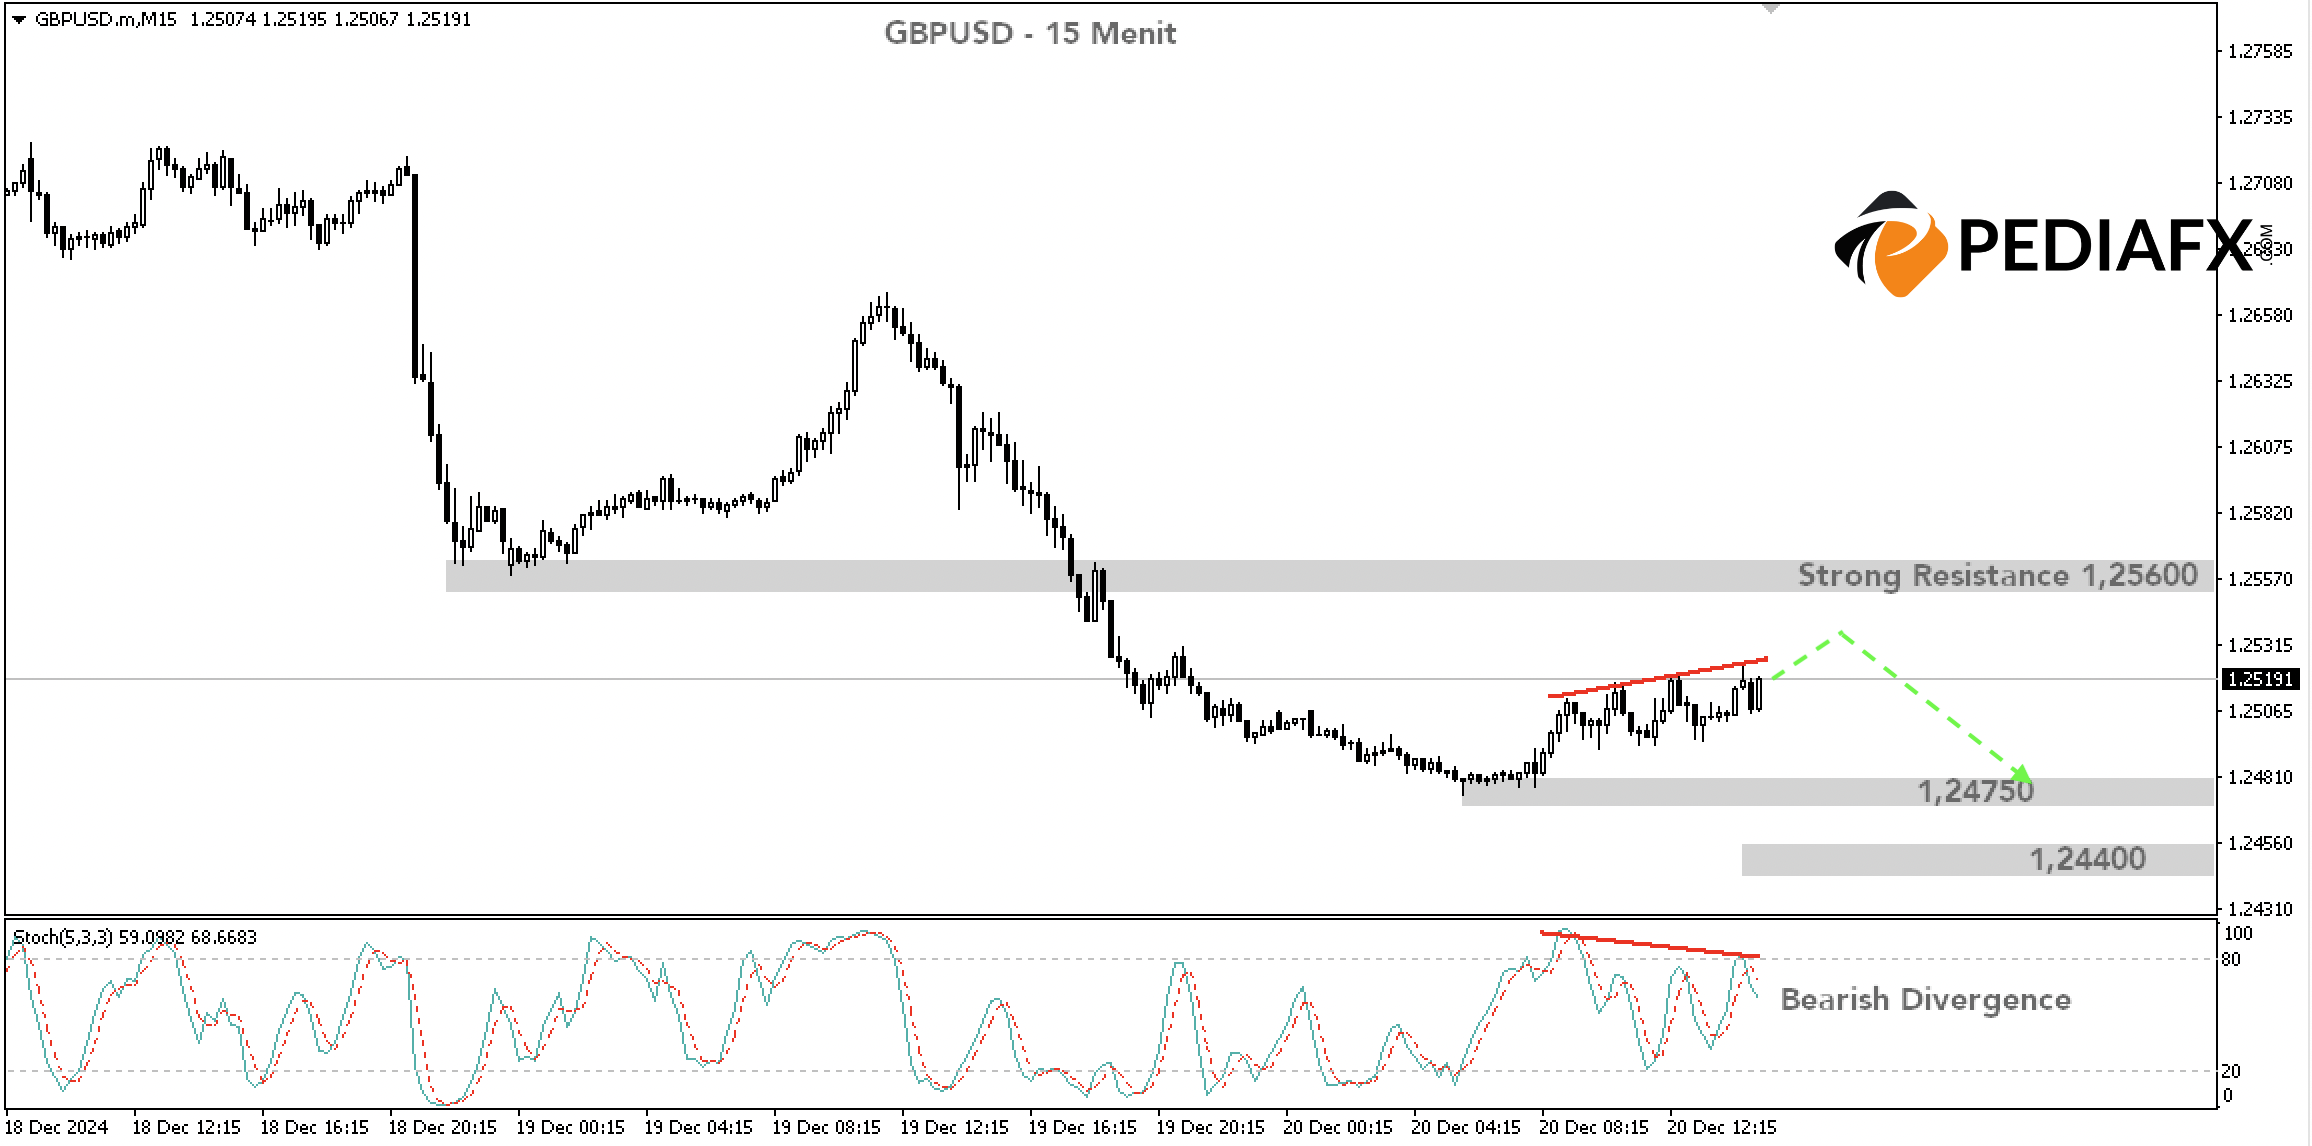
The GBPUSD pair has been experiencing a downward trend since the 20-period Moving Average (MA) crossed below the 50-period MA on the 1-hour chart. This currency pair has now reached its lowest point in over the past 7 months.
The Stochastic indicator on the daily chart has moved out of the overbought territory, indicating a significant potential for further declines.
ที่แนะนำ
ที่แนะนำ
ที่แนะนำ
ที่แนะนำ

On the 15-minute chart, Stochastic appears to be forming a Bearish Divergence pattern, increasing the likelihood of another decline. Strong resistance is noted around the 1.25600 level; as long as the price remains below this level, GBPUSD could potentially drop to 1.24750, before targeting 1.24400.
Technical References: sell while below 1.25600
Potential Take Profit 1: 1.24750
Potential Take Profit 2: 1.24400
Potential Stop Loss 1: 1.25600
Potential Stop Loss 2: 1.26000


