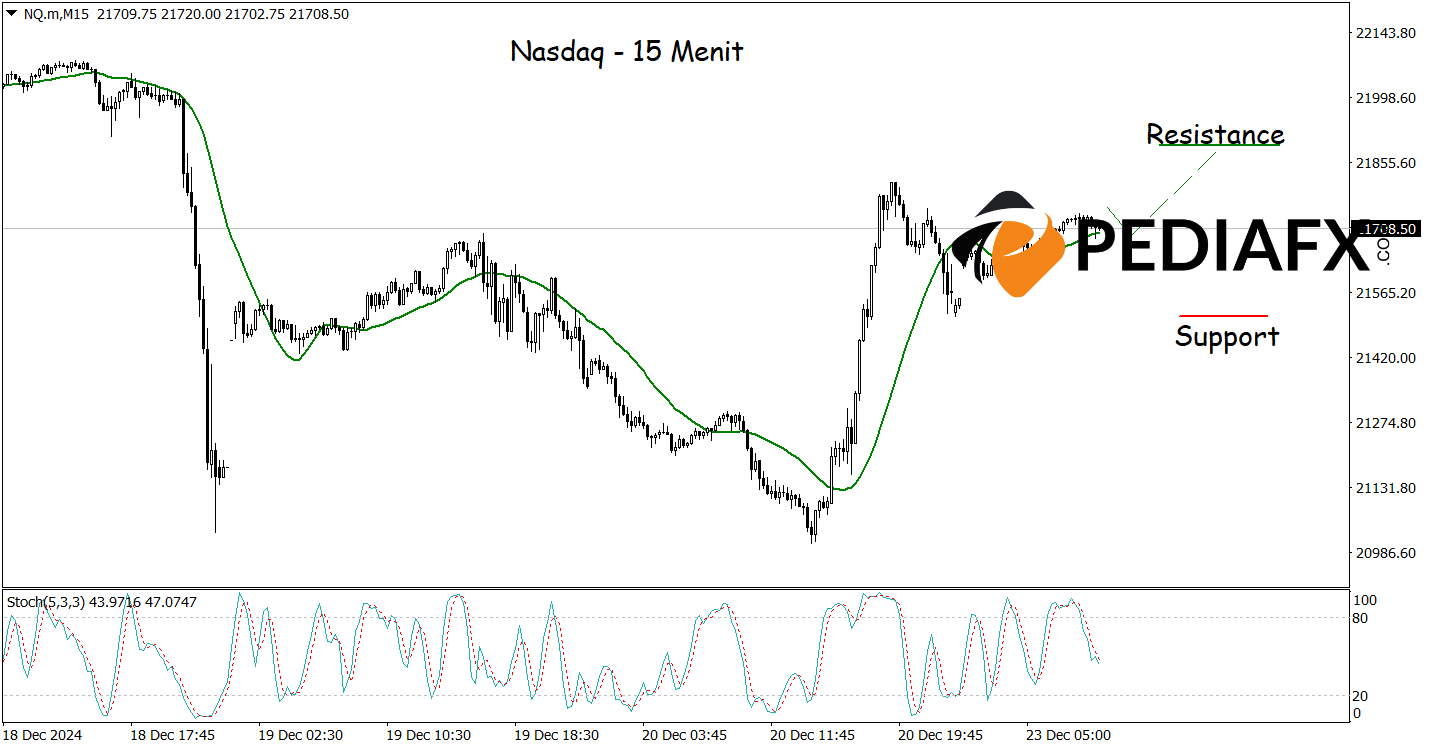
The Nasdaq exhibits potential to continue its upward trend, supported by positive signals from the 24 Moving Average (MA) and the Moving Average Convergence Divergence (MACD) indicator. Over the past few days, these indicators have provided strong hints that bullish momentum is gaining strength, presenting opportunities for traders to establish buy positions.
The 24 MA indicates that the current price is above the moving average, which often signals that an upward trend is in play. When prices rise above the MA, it reflects a generally positive market sentiment, leading investors to be more inclined to buy.
ที่แนะนำ
ที่แนะนำ
ที่แนะนำ
ที่แนะนำ

Aligning with the one-hour chart analysis, the 15-minute chart above also indicates a buy signal as the Stochastic indicator, which is currently in the oversold territory, reinforces the likelihood of an increase. If the scenario unfolds as expected, the Nasdaq could rise to test the resistance level at 21,890.
Technical Reference: buy as long as above 21,500
Potential Take Profit 1: 21,815
Potential Take Profit 2: 21,890
Potential Stop Loss 1: 21,590
Potential Stop Loss 2: 21,500


