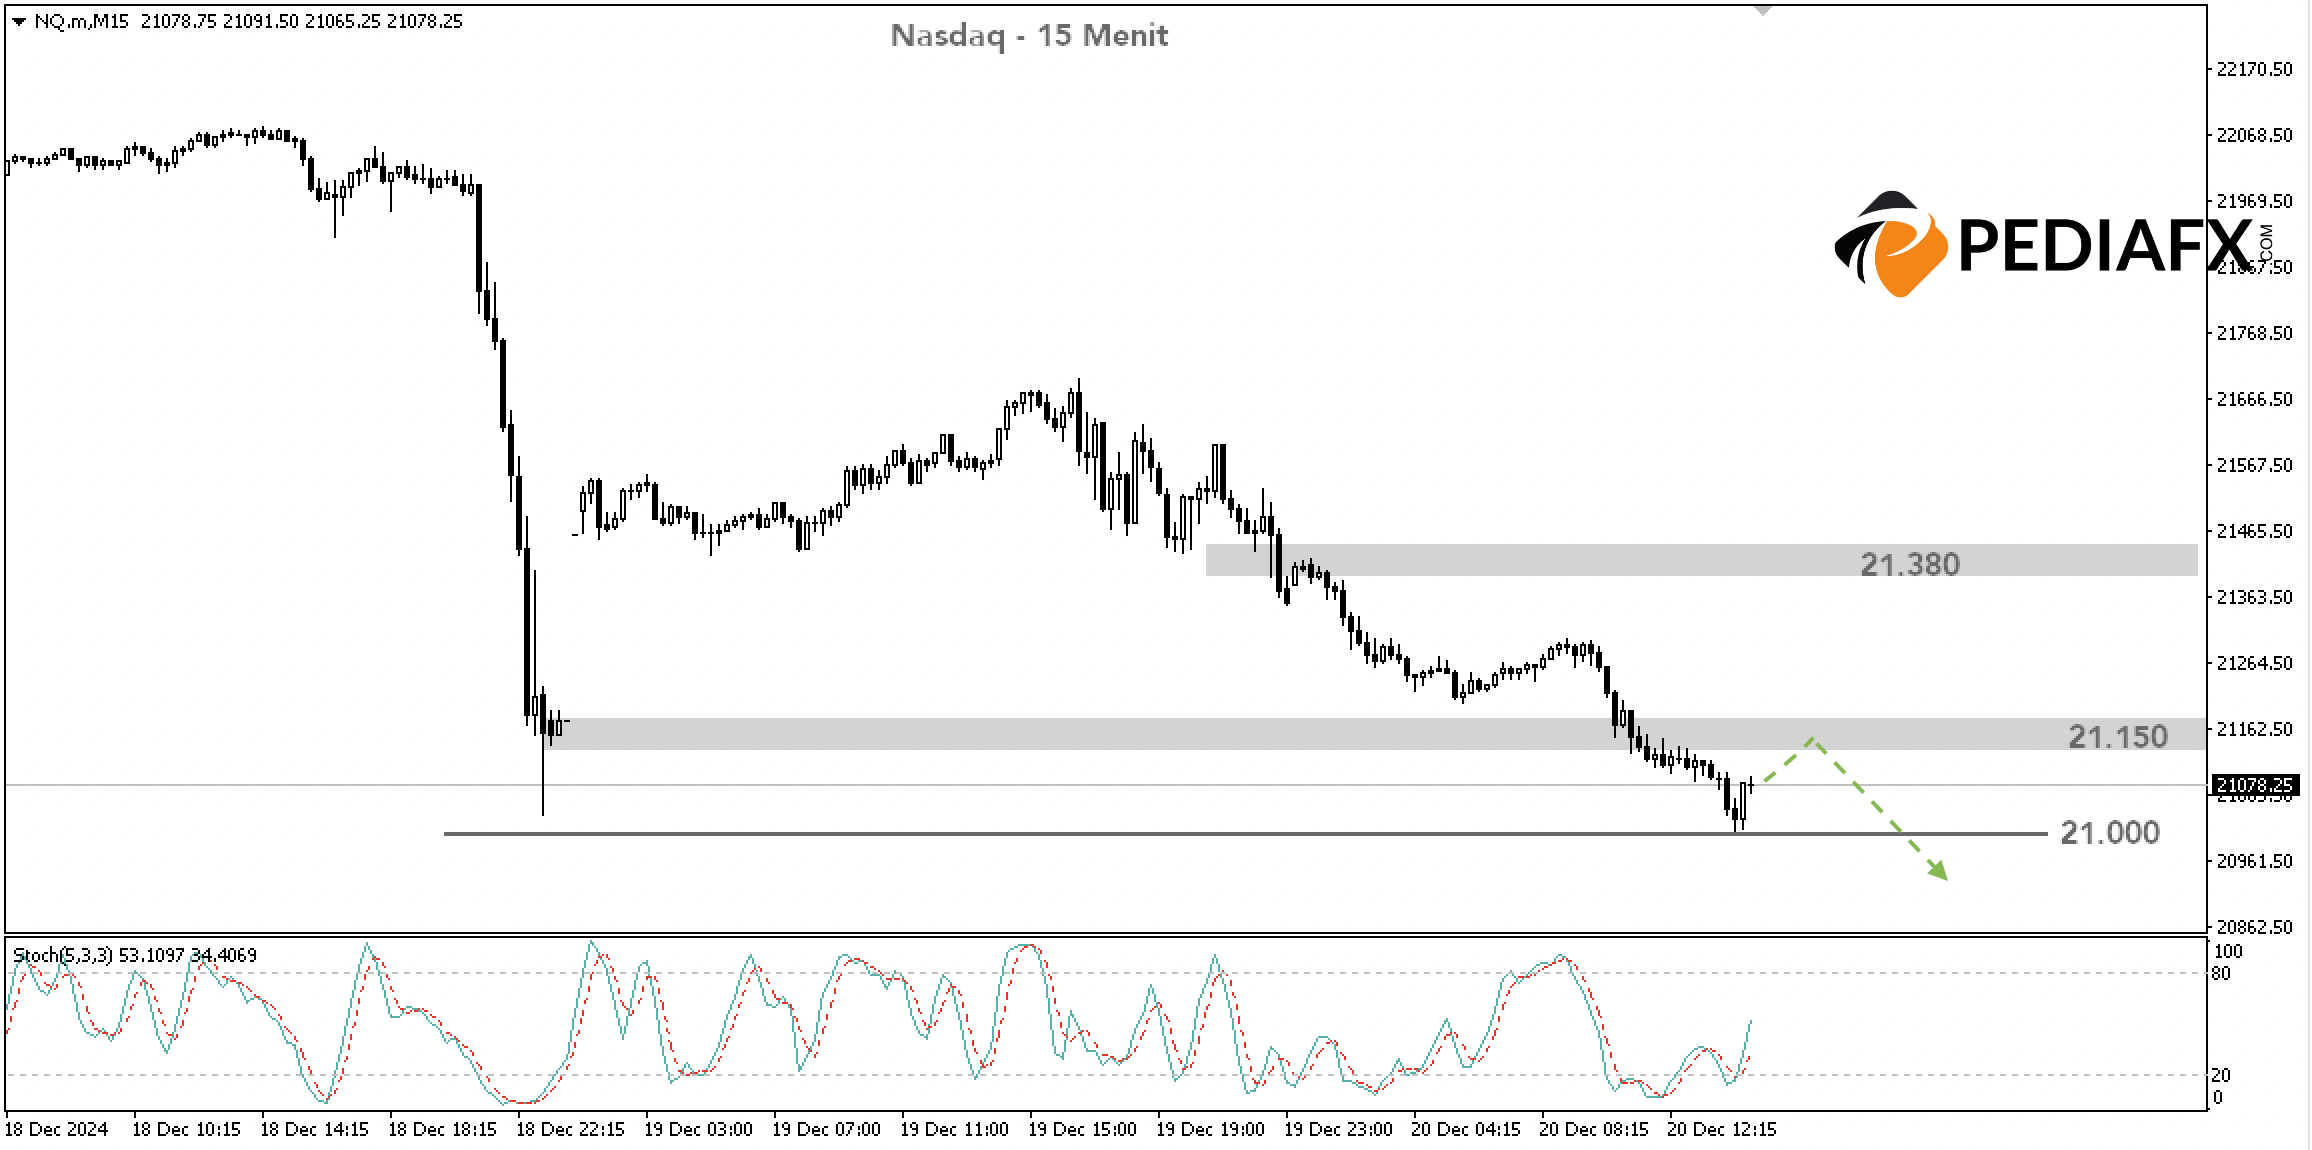
On Friday, December 20, 2024, the Nasdaq index saw a sharp decline at the beginning of the European trading session, hitting its initial decline target of 21,150 as indicated by previous technical analyses.
The lowest point of the day was recorded at 21,007, which means it was just shy of the subsequent target at 21,000.
рекомендуемые
рекомендуемые
рекомендуемые
рекомендуемые
The Nasdaq continues to face considerable pressure, as seen on the 1-hour chart where it remains below the 20-period and 50-period Moving Averages, which have already crossed each other.
However, the Stochastic indicator has entered the oversold territory and is beginning to show signs of recovery. This suggests the possibility of a rebound, creating an opportunity for sell positions with a more favorable risk-reward ratio.

Examining the 15-minute chart, the Stochastic has risen from the oversold zone, reinforcing the potential for a short-term upswing. The resistance level at 21,380 remains strong, while 21,150 has now become the nearest resistance; unless Nasdaq surpasses this level, it could drop to the psychological barrier of 21,000. Should it manage to break through this level consistently, the Nasdaq may head towards 20,870.
Technical References: Продавать when below 21,150
Потенциальная прибыль 1: 21 000
Потенциальная прибыль 2: 20 870
Потенциальный стоп-лосс 1: 21 150
Потенциальный стоп-лосс 2: 21 380


