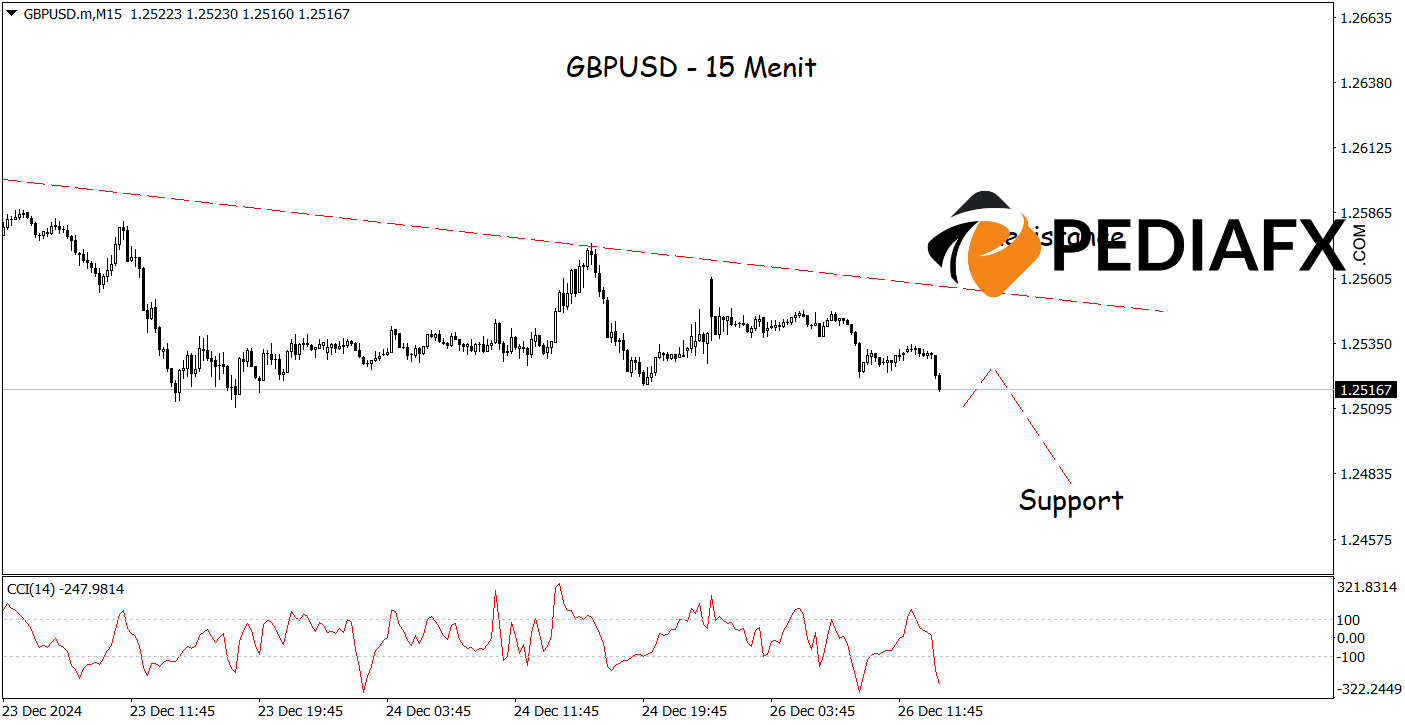
According to the technical overview of the European markets, GBPUSD has experienced a downturn, continuing to face selling pressure after a breakout below the crucial поддерживать level. The Moving Average (MA) indicator with a 24-period setting reinforces the медвежий signal, as it trends downward. This suggests a dominating selling pressure within the short-term trend.
Additionally, the MACD indicator supports the медвежий sentiment, with its signal line positioned beneath the zero mark and the histogram reflecting negative momentum. The recent breakout has been followed by a pullback towards the resistance area, creating opportunities for market participants to sell.
рекомендуемые
рекомендуемые
рекомендуемые
рекомендуемые

In alignment with the hourly chart analysis above, the 15-minute chart for GBPUSD also presents a bearish outlook. The Stochastic CCI indicator indicates strong медвежий conditions, signaling a downward momentum. This positions GBPUSD for a potential decline towards the поддерживать level of 1.24780.
Technical Reference: Sell while below 1.25700
Potential Stop Loss 1: 1.25565
Potential Stop Loss 2: 1.25700
Potential Take Profit 1: 1.24950
Potential Take Profit 2: 1.24780


