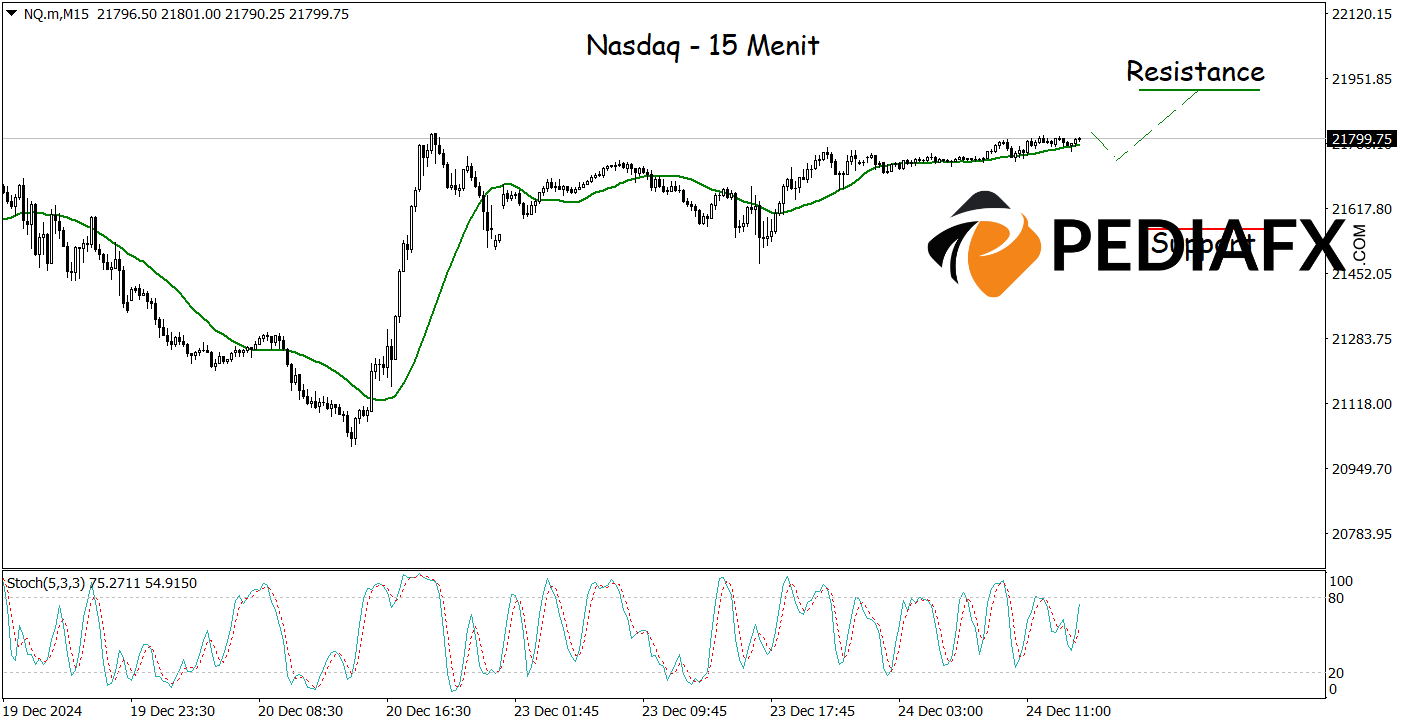
The Nasdaq index continues to exhibit the potential for an upward momentum, bolstered by crucial technical indicators, namely the Moving Average (MA) and the Moving Average Convergence Divergence (MACD), both of which are signaling positively.
The MA indicator illustrates that prices are trading above the moving average line, suggesting a stable upward trend. Meanwhile, the MACD reinforces the bullish outlook as the MACD line hovers above the signal line with its histogram positioned in positive territory, indicating a strong upward momentum.
Recommended
Recommended
Recommended
Recommended
This combination of signals reflects an optimistic market sentiment towards the Nasdaq, presenting opportunities for continued price increases towards the next resistance levels.

In alignment with the one-hour chart analysis, the 15-minute chart also reveals buy signals, as the MACD remains in positive territory, potentially supporting the Nasdaq’s rise. If this scenario plays out, the Nasdaq could test the resistance level at 22,160.
Technical Reference: Buy while above 21,945
Potential Take Profit Level 1: 22,120
Potential Take Profit Level 2: 22,160
Potential Stop Loss Level 1: 21,980
Potential Stop Loss Level 2: 21,945


