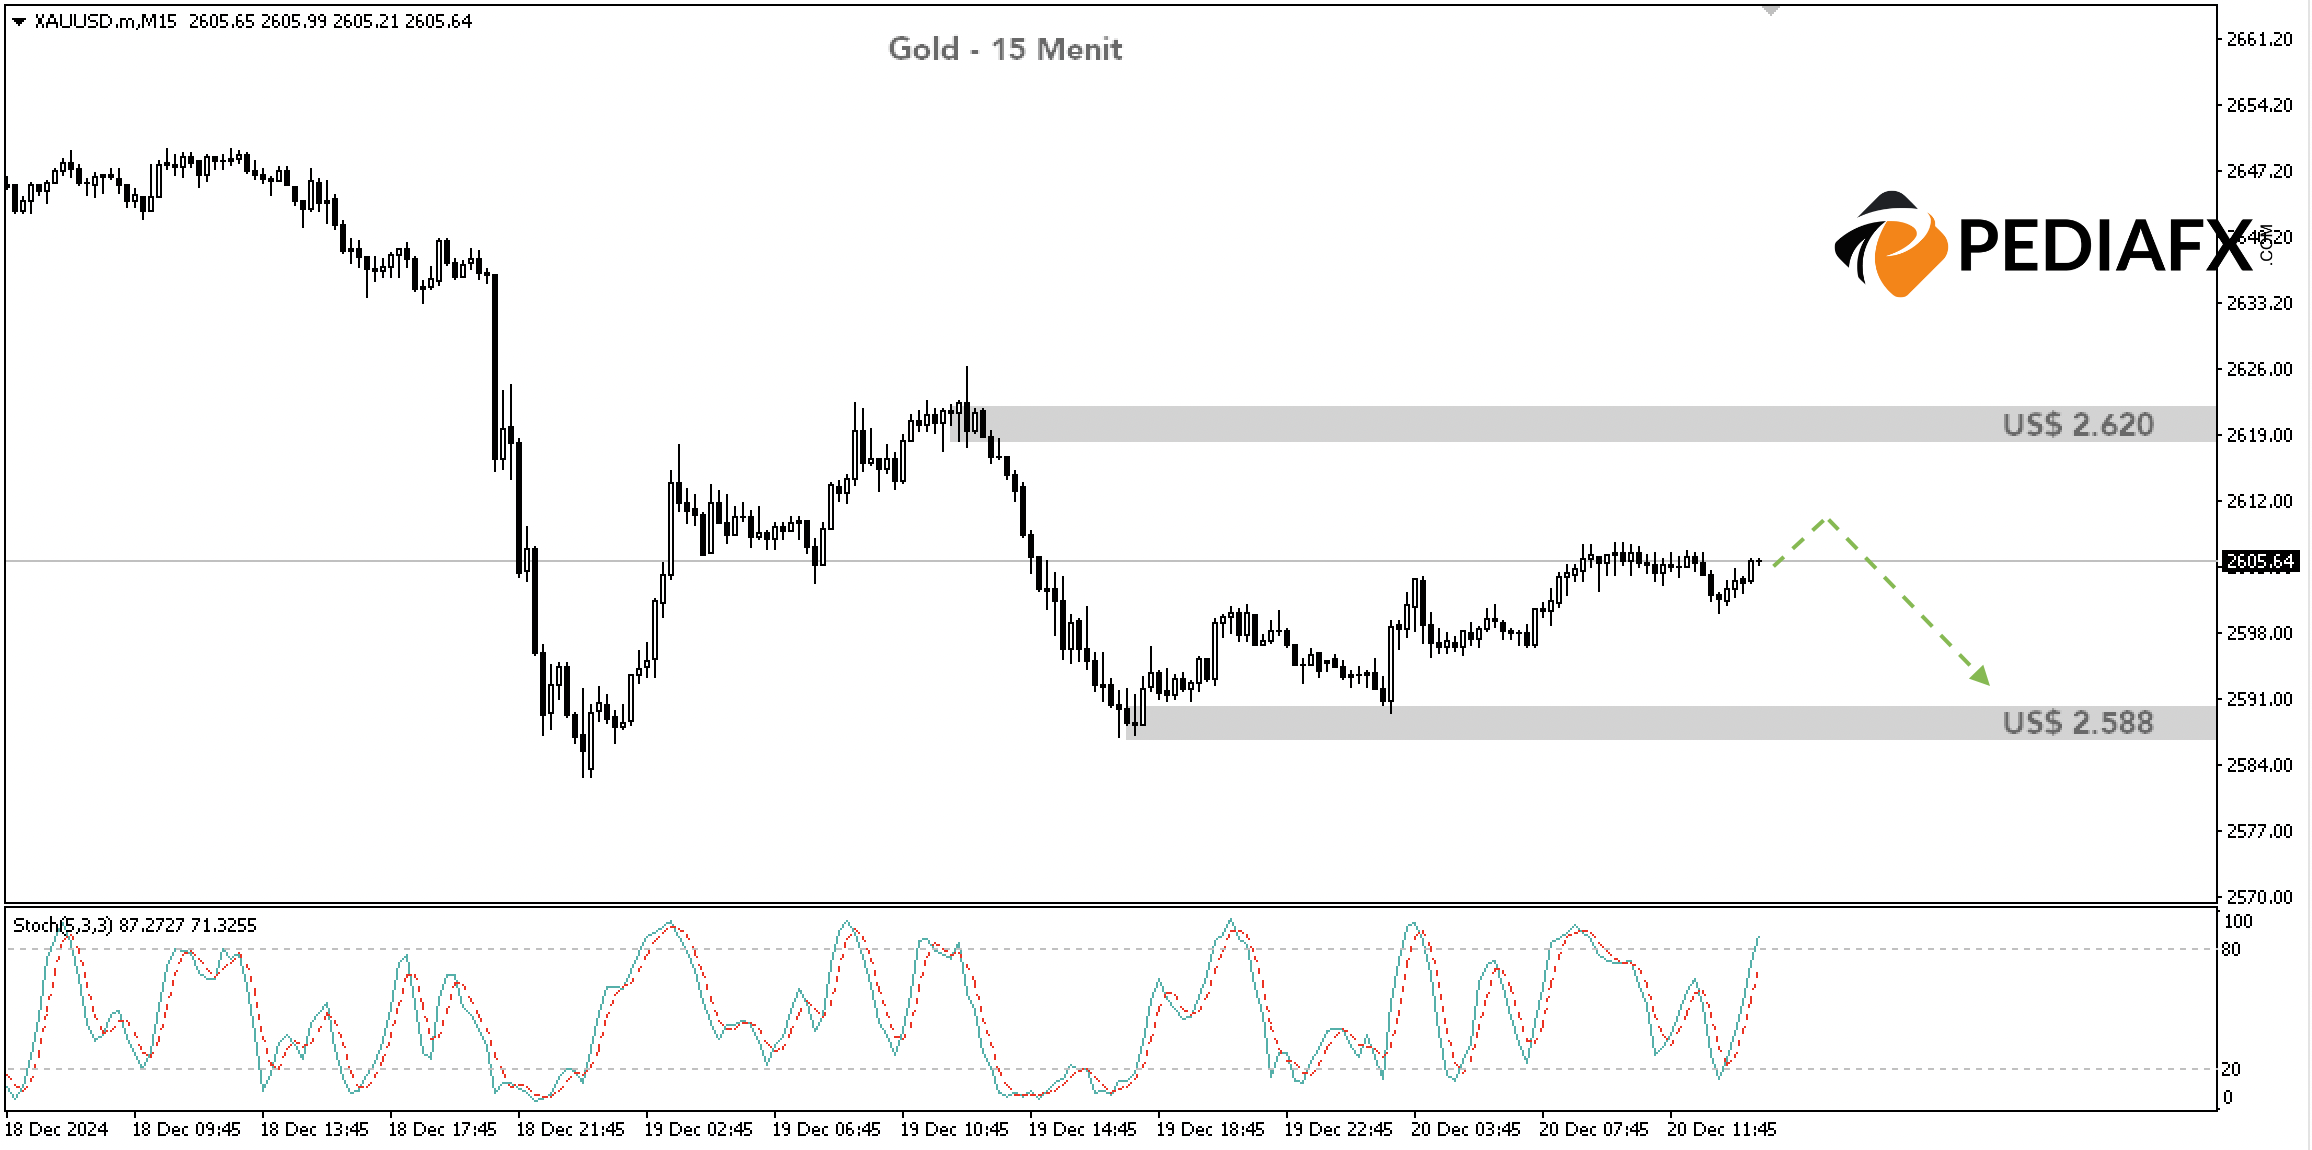
Gold prices remained relatively stable at the start of the European trading session on Friday (December 20, 2024), showing no significant technical level changes to be aware of.
On the hourly chart, Gold is observed to be trading below the trendline established since December 12. As long as it remains below this trendline, Gold may continue its downward trend.
Disyorkan
Disyorkan
Disyorkan
Disyorkan
The $2,620 per troy ounce area acts as a strong resistance level. Historically, this price range has served as a support level that previously halted Gold’s price decreases. Since breaking below it last Wednesday, Gold has been unable to reclaim the level, making it a solid case of support turning into resistance.
The Stochastic indicator is showing a downward movement after reaching a zone of overbought conditions. Thus, the potential for further decline appears greater.

On the 15-minute chart, the Stochastic indicator is rising and beginning to enter the overbought territory. If Gold experiences an increase in this timeframe, it could provide a selling opportunity with a more favorable risk-reward ratio. This is because when the Stochastic remains in the overbought area for an extended period, there is a possibility that prices will reverse downwards, while the trend on the hourly timeframe continues to be bearish as well.
As long as it is held below $2,620, there is a possibility for Gold to decline towards the $2,588 range. If that level is breached, Gold might further drop to $2,580.
Technical Reference: Sell while below $2,620
Potential Take Profit 1: $2,588
Potential Take Profit 2: $2,580
Potential Stop Loss 1: $2,620
Potential Stop Loss 2: $2,629


