The GBPUSD currency pair has been on a downward trend since the 20-period Moving Average (MA) crossed below the 50-period MA on the hourly chart. As a result, it has reached its lowest point in over seven months.
On the daily chart, the Stochastic indicator has declined from the overbought territory, indicating that the potential for further declines remains significant.
Disyorkan
Disyorkan
Disyorkan
Disyorkan

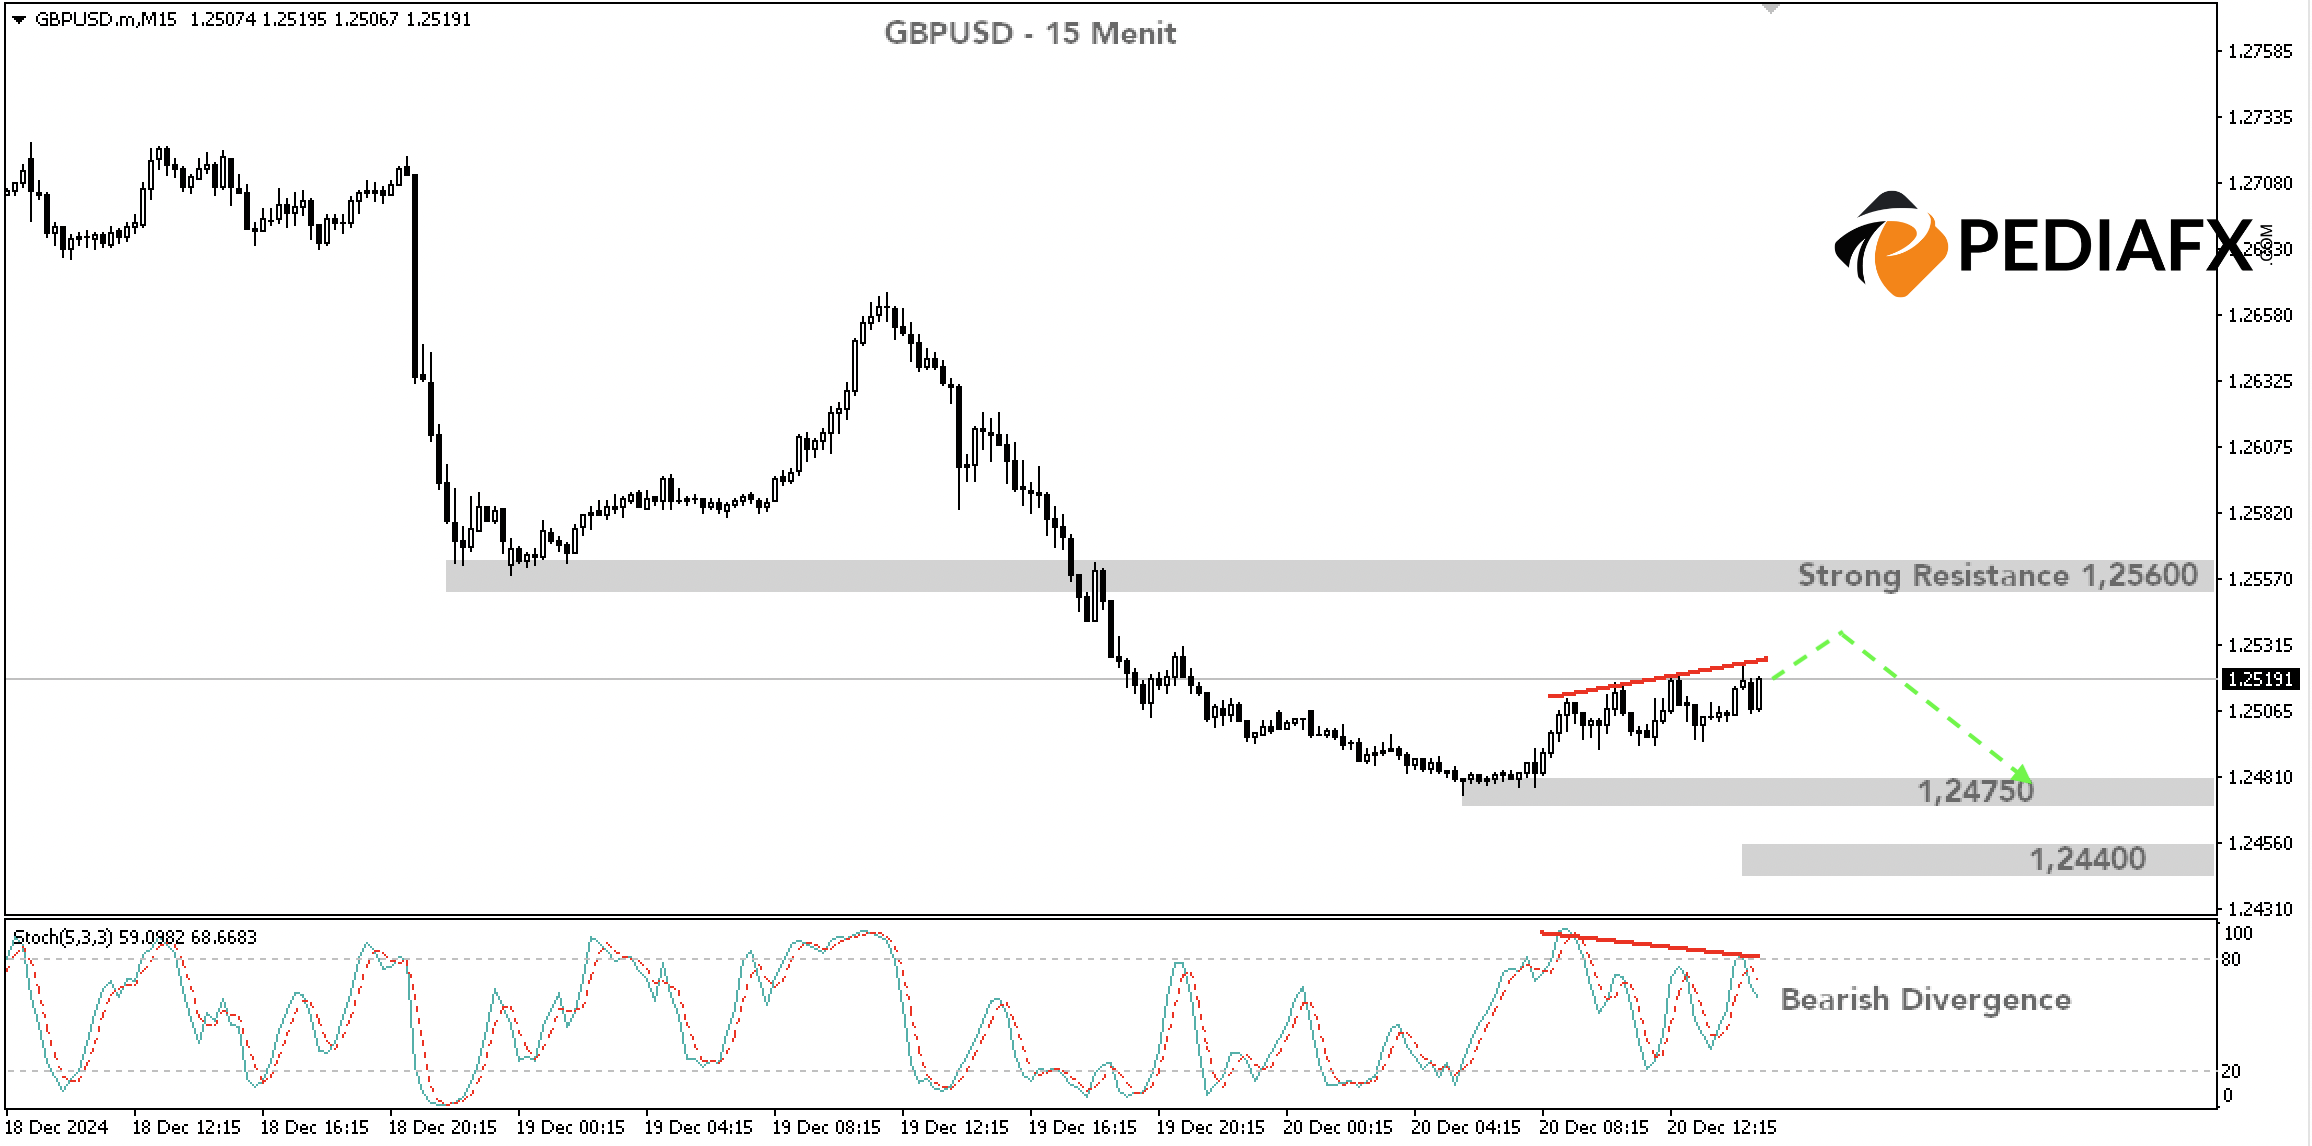
Looking at the 15-minute chart, the Stochastic indicator shows a pattern of Bearish Divergence, suggesting an increased likelihood of price drops. A robust resistance zone can be identified around 1.25600; as long as the price remains below this level, there is potential for GBPUSD to slide to 1.24750 before reaching 1.24400.
Rujukan Teknikal: jual while below 1.25600
Potential Take Profit 1: 1.24750
Potential Take Profit 2: 1.24400
Potential Stop Loss 1: 1.25600
Potential Stop Loss 2: 1.26000


