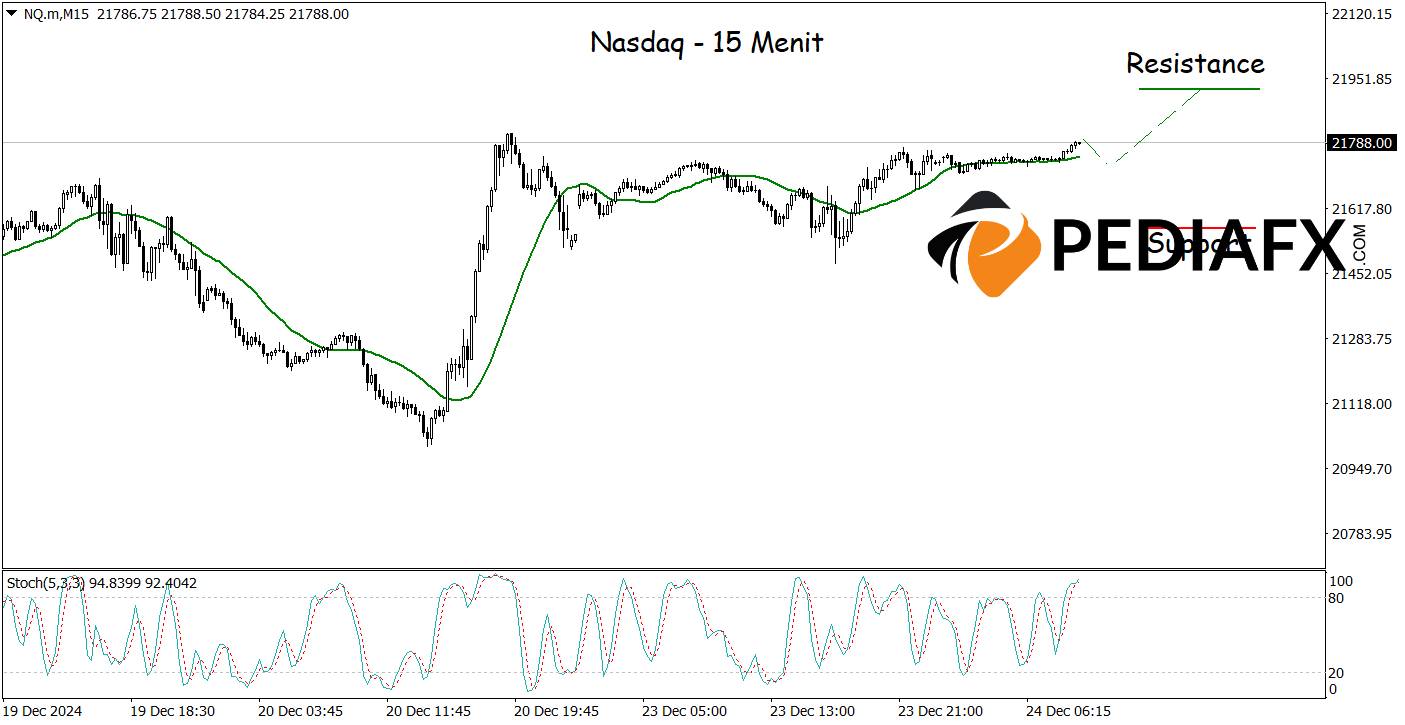
The Nasdaq is poised to continue its upward trajectory, buoyed by favorable signals from the 24-period Moving Average (MA) and the Moving Average Convergence Divergence (MACD) indicators. Recent trading sessions have shown robust indications that bullish momentum is strengthening, presenting a favorable environment for investors to consider entering long positions.
The 24 MA indicator suggests that current prices are trading above the moving average, often signaling an ongoing upward trend. When prices are above the MA, it reflects a generally optimistic market sentiment, making it more likely for investors to pursue buying opportunities.
Recommended
Recommended
Recommended
Recommended

In agreement with the analysis from the one-hour chart, the 15-minute chart above also shows buy signals as the Stochastic indicator, which has been in an oversold condition, further supports the possibility of a price increase. Following this scenario, the Nasdaq could test the resistance level at 21,930.
Technical Reference: buy while above 21,500
Potential Take Profit 1: 21,815
Potential Take Profit 2: 21,930
Potential Stop Loss 1: 21,635
Potential Stop Loss 2: 21,565


