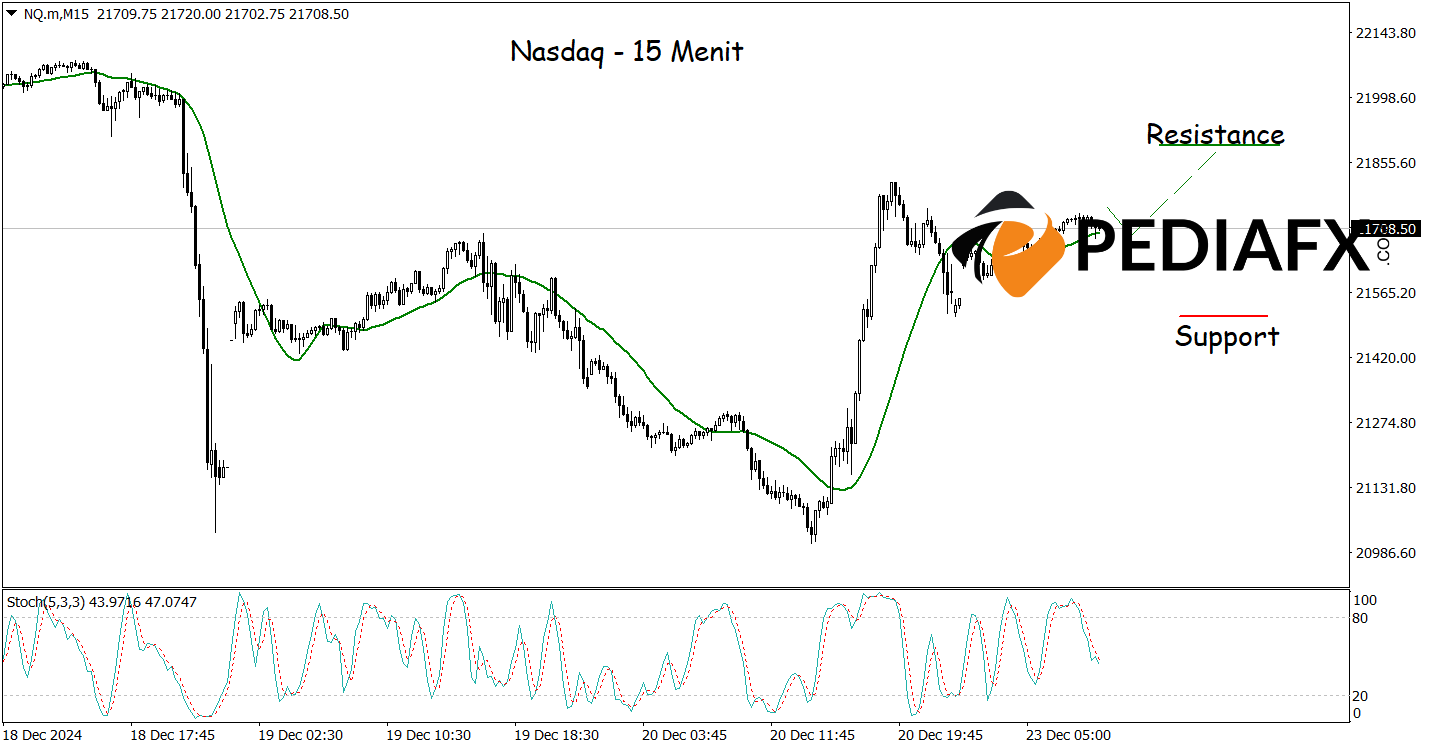
The Nasdaq index appears ready to continue its upward trend, buoyed by encouraging signals from the 24-period Moving Average (MA) and the Moving Average Convergence Divergence (MACD) indicator. In recent days, both of these tools have emitted strong signals suggesting that bullish momentum is gaining strength, thereby creating opportunities for traders to consider buying positions.
The 24-period MA indicates that current prices are trading above the moving average, which is typically interpreted as a signal of an ongoing uptrend. When prices remain above the MA, it suggests a generally positive market sentiment, leading investors to lean more toward purchasing assets.
Recommended
Recommended
Recommended
Recommended

Alongside this hourly chart analysis, the 15-minute chart also displays buying signals as the Stochastic indicator moves out of the oversold territory, further reinforcing the potential for price increases. Should this scenario unfold, the Nasdaq could very well test the resistance level at 21,890.
Technical Reference: Buy while above 21,500
Potential Take Profit Level 1: 21,815
Potential Take Profit Level 2: 21,890
Potential Stop Loss Level 1: 21,590
Potential Stop Loss Level 2: 21,500


