On the 1-hour chart, gold prices are seen moving beneath a trendline established since December 12. While confined below this trendline, gold is likely to continue its downward trajectory.
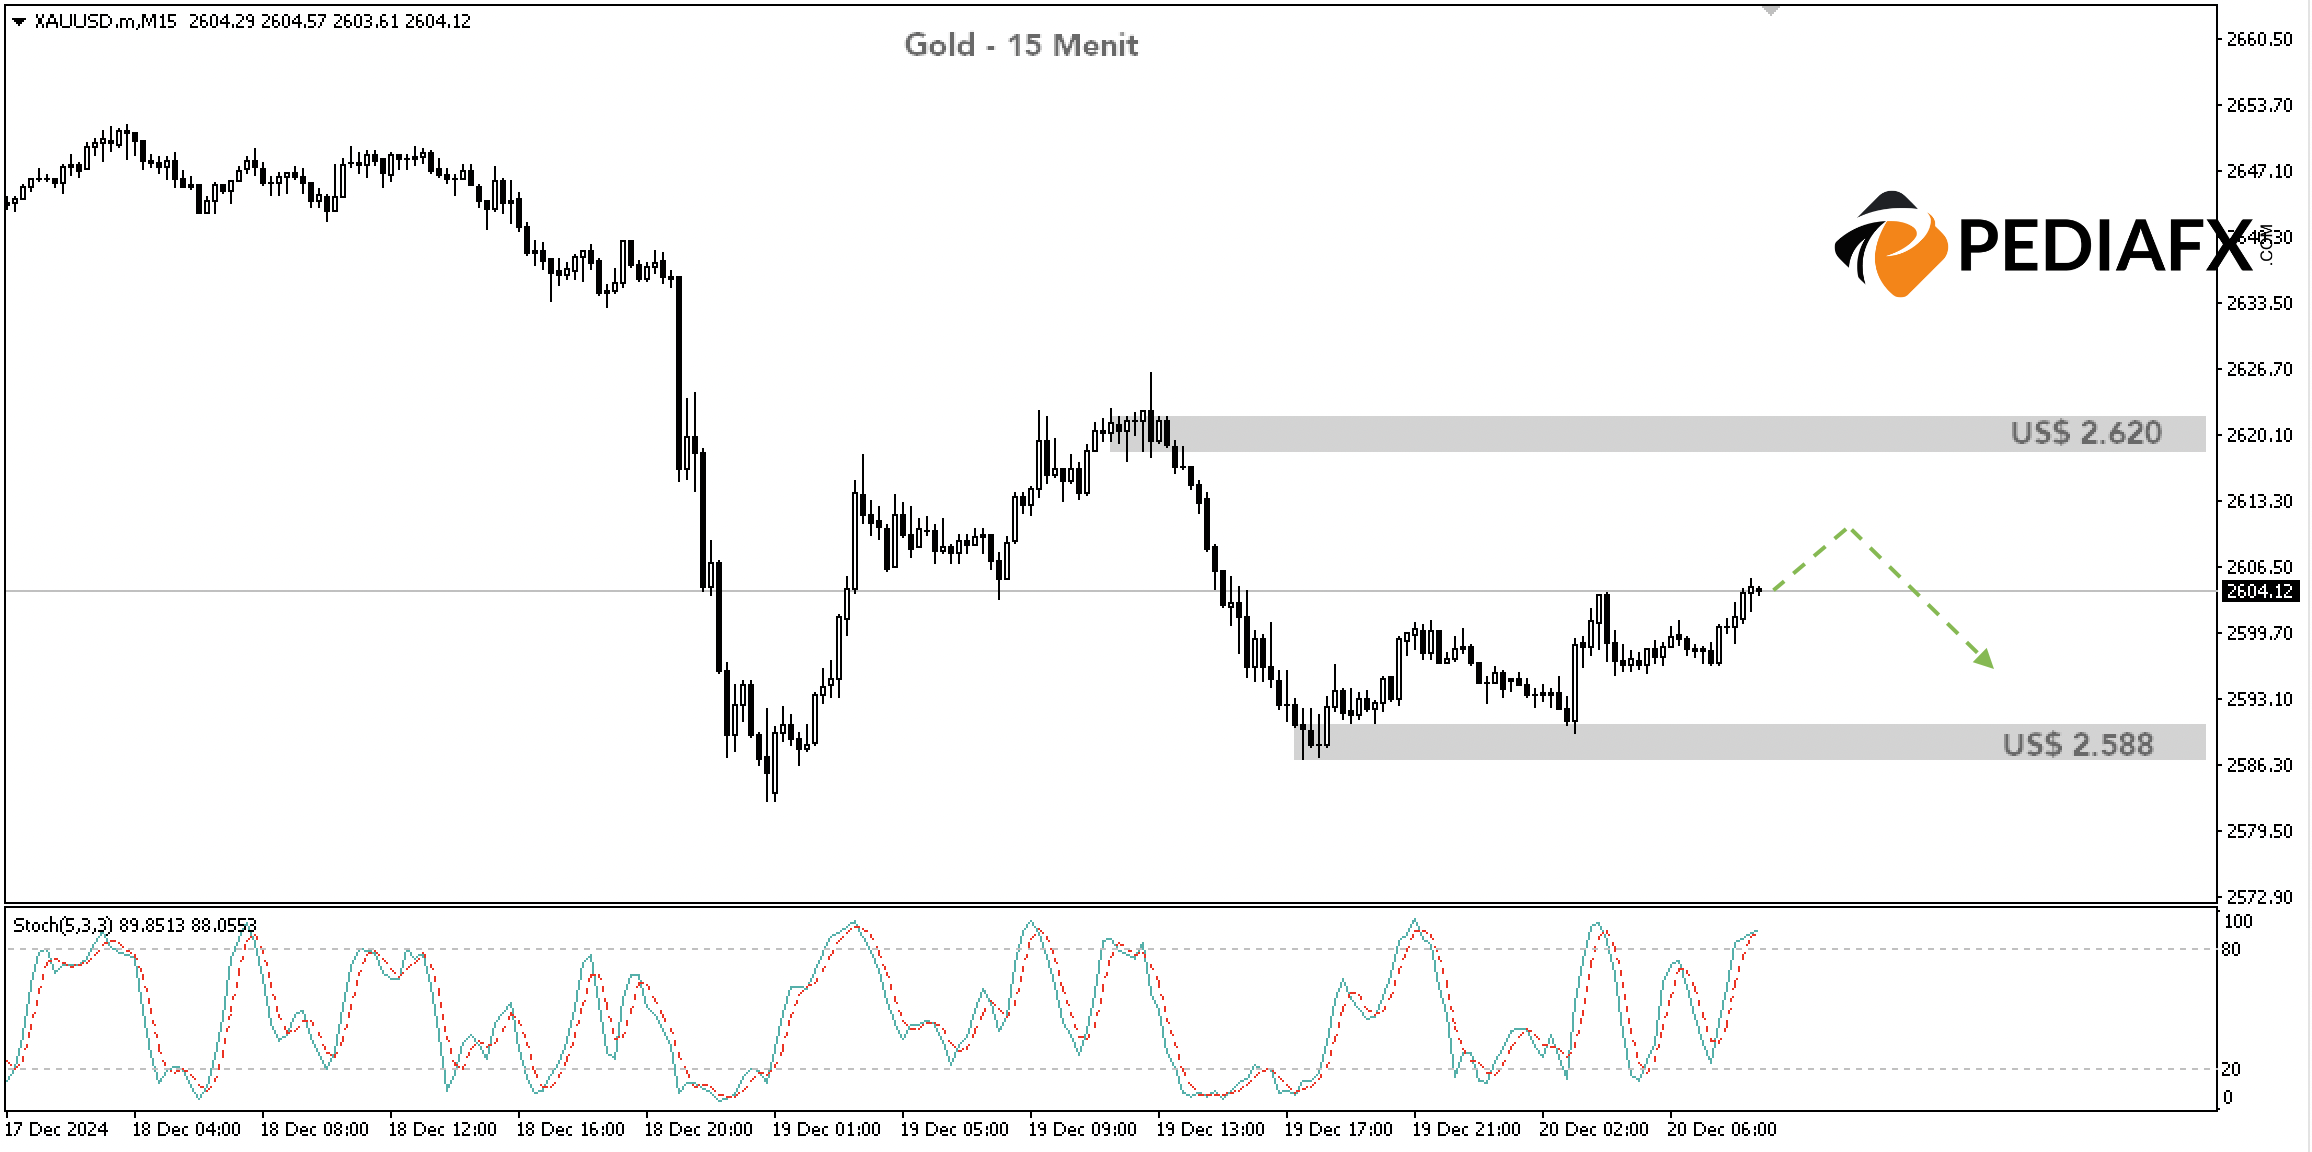
The US$ 2,620 per troy ounce area serves as a significant resistance level. Historically, this price range has acted as a strong support that prevented further declines in gold prices. Since breaking through it last Wednesday, gold has failed to return above this level, making it a robust support turned resistance.

In the 15-minute chart, the Stochastic indicator has already entered the overbought territory, increasing the likelihood of a decline.
As long as gold remains under US$ 2,620, there is potential for it to drop to around US$ 2,588. If this level is breached, gold could potentially decline further to US$ 2,580.
Technical References: sell while below US$ 2,620
Potential Take Profit 1: US$ 2,588
Potential Take Profit 2: US$ 2,580
Potential Stop Loss 1: US$ 2,620
Potential Stop Loss 2: US$ 2,629


