On the hourly chart, the price of Gold is observed moving below the Trendline established since December 12th. As long as it remains underneath this Trendline, Gold is likely to continue its downward trend.
The area around US$ 2,620 per troy ounce acts as a strong resistance. Historically, this level has served as support that has prevented the price of Gold from declining further. Since it was breached last Wednesday, Gold has not yet reclaimed this level, solidifying it as a strong resistance.
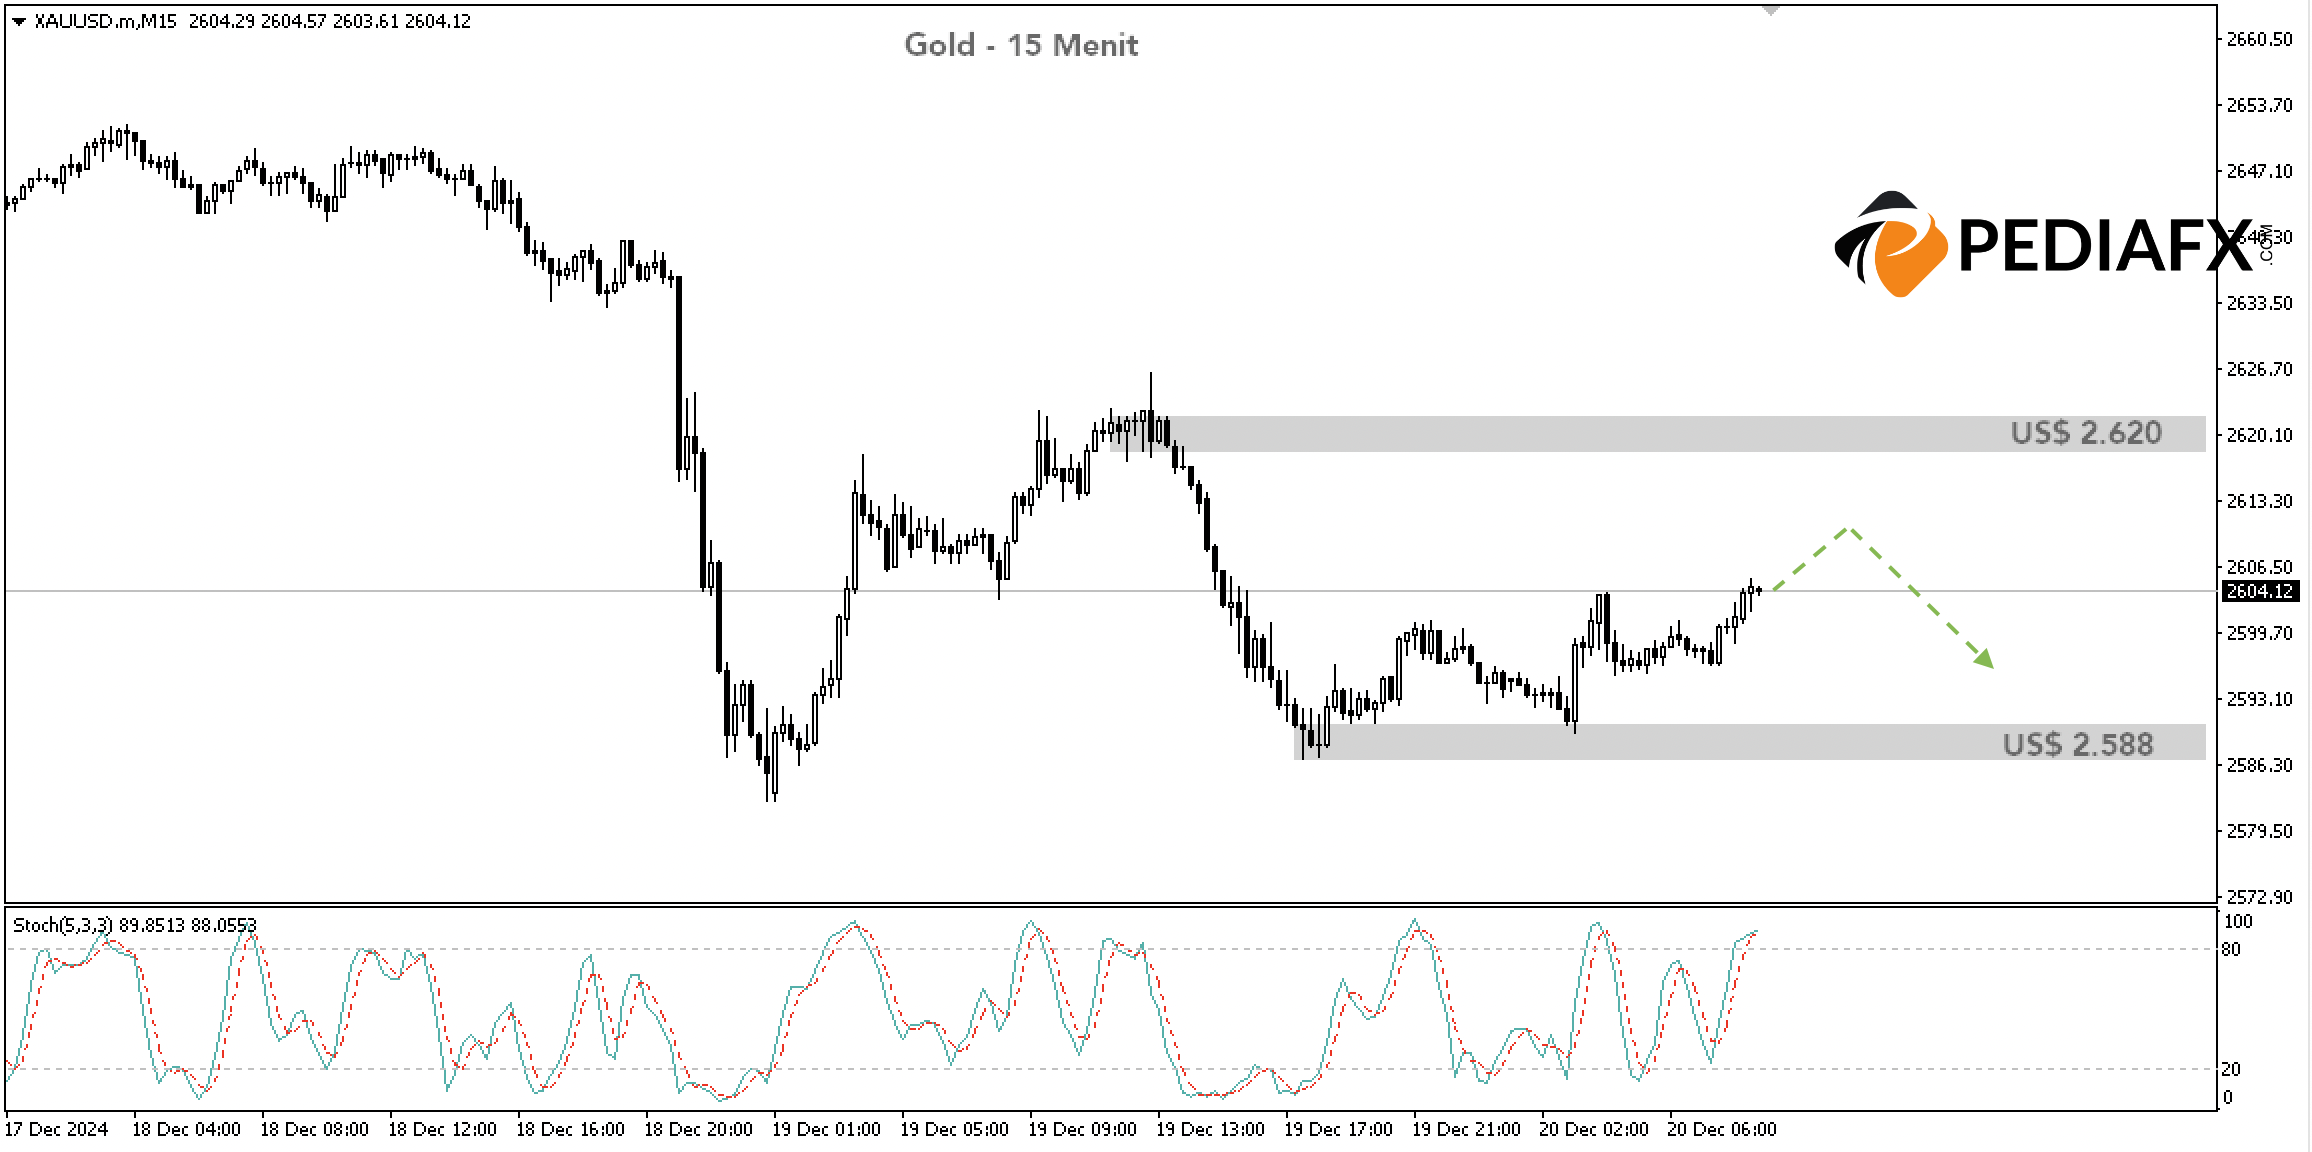
The Stochastic indicator is also trending upwards and approaching the overbought territory. As it nears this resistance level, the Stochastic could enter overbought conditions, increasing the likelihood of a reversal.

On the 15-minute chart, the Stochastic has already entered the overbought zone, thereby heightening the potential for a decline.
While it remains below US$ 2,620, Gold has the potential to decrease towards the US$ 2,588 level. If this level is broken, Gold could further decline to US$ 2,580.
Technical Reference: sell while below US$ 2,620
Potential Take Profit 1: US$ 2,588
Potential Take Profit 2: US$ 2,580
Potential Stop Loss 1: US$ 2,620
Potential Stop Loss 2: US$ 2,629


