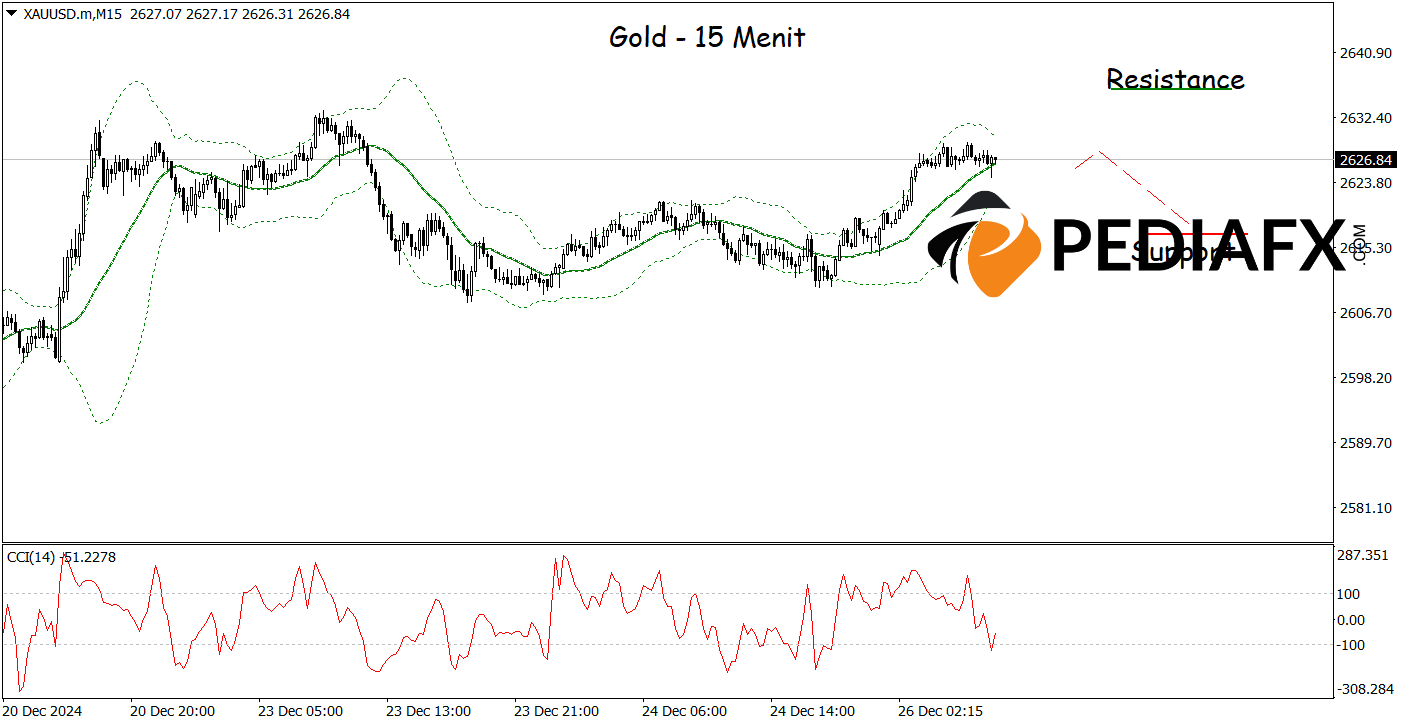
The current price of gold has reached the upper boundary of the Bollinger Band, a technical indicator frequently utilized to assess volatility and identify potential support or resistance levels. This situation, coupled with the Stochastic indicator signaling an overbought condition, suggests a possible price correction ahead.
Typically, when gold prices touch the upper limit of the Bollinger Band, there is a common tendency for them to retreat towards the center. The Stochastic indicator being in the overbought zone indicates that the bullish momentum may be beginning to wane, potentially paving the way for a selling opportunity soon.

Analyzing the 15-minute chart, gold presents bearish signals as it struggles to break through the upper Bollinger Band, indicating that selling opportunities are still on the table. Additionally, the sharp decline in the Commodity Channel Index (CCI) from the oversold zone reinforces the selling potential. If this scenario unfolds as expected, gold prices might move towards a support level at 2,636.00.
技術リファレンス: 売る while below 2,636.00
潜在的 ストップロス 1: 2,633.00
潜在的 ストップロス 2: 2,636.00
潜在的 利益確定 1: 2,620.00
潜在的 利益確定 2: 2,617.00


