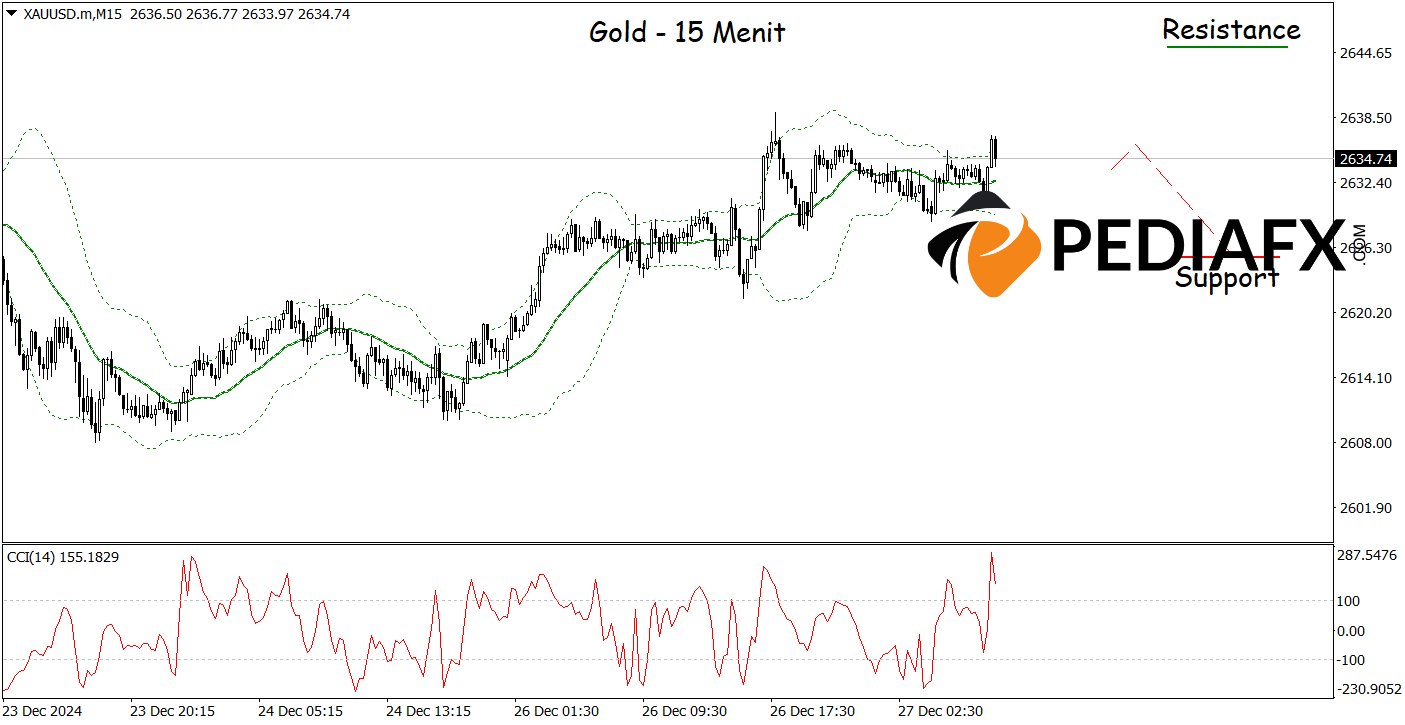
The current Gold price is hovering near the upper limit of the Bollinger Band, suggesting that it is approaching an 買われ過ぎ condition. This scenario is further confirmed by the Stochastic indicator, which is also indicating an 買われ過ぎ status, hinting at a potential price correction in the near future.
From a technical analysis perspective, Bollinger Bands are frequently employed to assess market volatility. When prices reach the upper band, it is common for a trend reversal to occur, moving back towards the middle line as part of the regular price movement pattern. The Stochastic 買われ過ぎ condition reinforces the idea that buying pressure is beginning to wane, paving the way for selling opportunities.

On the 15-minute chart, Gold is presenting a 弱気 signal, as prices have failed to breach the upper boundary of the Bollinger Bands, indicating a selling opportunity. Additionally, the CCI (Commodity Channel Index) is in a state of oversold, adding to the potential for a downward movement. If this scenario unfolds as anticipated, Gold prices might drop to a サポート level of $2,624.00.
技術リファレンス: 売る while below 2,645.00
潜在的 ストップロス 1: 2,640.00
潜在的 ストップロス 2: 2,645.00
潜在的 利益確定 1: 2,628.00
潜在的 利益確定 2: 2,624.00


