

The GBPUSD currency pair has started to experience increased selling pressure on the hourly chart, with sellers gaining control over price movements during the US trading session. This situation is evident following a break below the low of the previously established bullish channel, which had served as a primary upward path. This weakening indicates that buying momentum is waning, signaling a shift towards a short-term corrective phase in the market.
From a technical perspective, the likelihood of further declines is supported by a downward trend in the Moving Average and a ZigZag pattern that shows a weakening structure. This combination of signals suggests that selling pressure remains substantial, thus providing GBPUSD with the potential to continue its decline towards the nearest support area, as long as the price does not manage to re-enter the prior bullish channel.


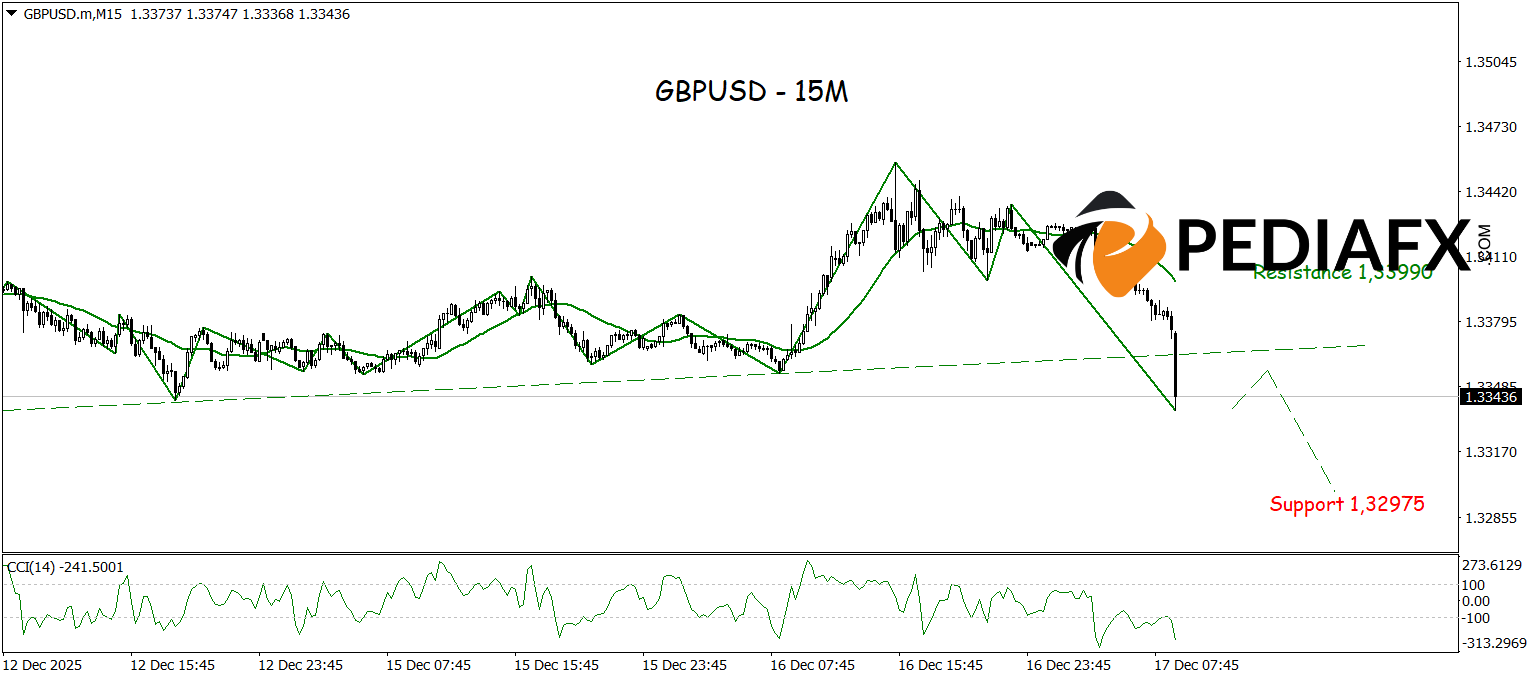
On the 15-minute chart, bearish pressure is becoming increasingly apparent after the price has broken below the bullish trendline, indicating a short-term structural change towards bearishness. The declining Moving Average and the ZigZag pattern forming a bearish structure reflect a strengthening dominance of the sellers. Given this technical condition, GBPUSD is positioned to move lower to test the support area at 1.32975, as long as the price remains beneath the breached trendline.
技術リファレンス: 売る while below 1.33990
潜在的 ストップロス 1: 1.33795
潜在的 ストップロス 2: 1.33990
潜在的 利益確定 1: 1.33145
潜在的 利益確定 2: 1.32975


