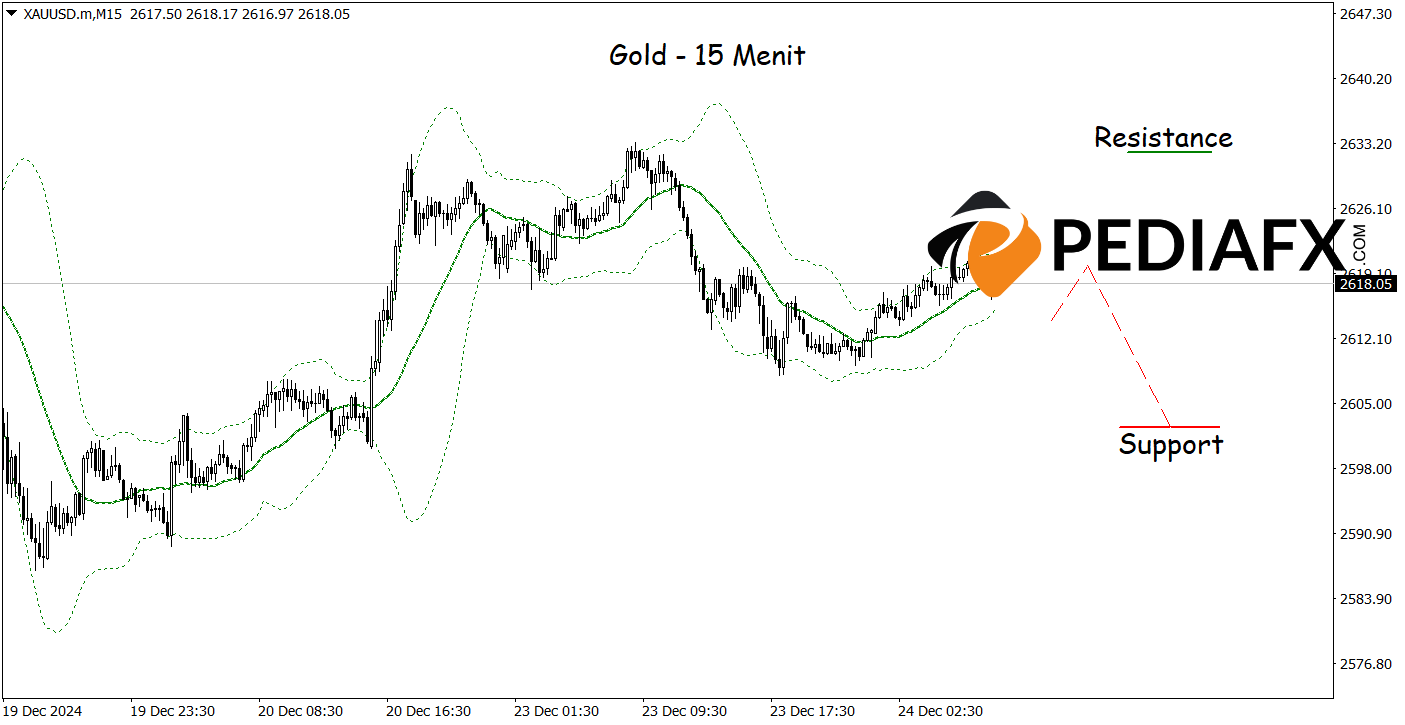
The current Gold market is displaying a bearish trend. Technical analysis utilizing the Bollinger Bands and Stochastic Oscillator suggests that Gold prices could continue to decline.
Bollinger Bands, comprising a middle line (moving average) and two outer lines that represent volatility, are indicating a bearish sentiment at this time. Furthermore, the Stochastic Oscillator aligns with this sentiment, as it records values above 80, signifying that Gold has reached an overbought state. Such conditions typically precede a price decrease, as markets tend to undergo corrections following sharp upward movements.
Direkomendasikan
Direkomendasikan
Direkomendasikan
Direkomendasikan

On the 15-minute chart, Gold exhibits a bearish signal, indicated by its inability to breach the lower boundary of the Bollinger Bands, suggesting that selling opportunities remain viable. If this scenario unfolds as anticipated, Gold prices could decline towards the support level of 2,602.00.
Referensi Teknis: Menjual if below 2,632.00
Potensi Hentikan Kerugian 1: 2,628.00
Potensi Hentikan Kerugian 2: 2,632.00
Potensi Ambil Untung 1: 2,606.00
Potensi Ambil Untung 2: 2,602.00


