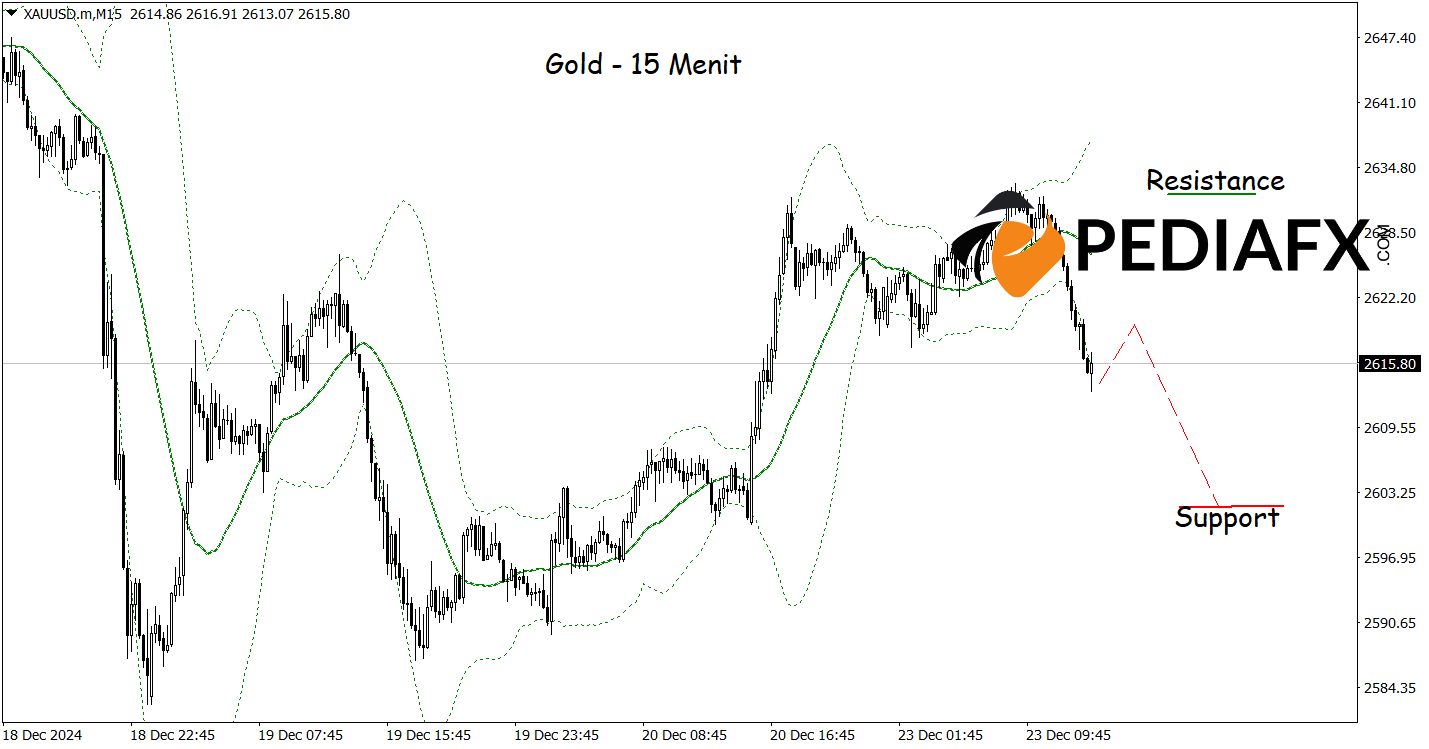
The price of Gold has faced rejection after hitting the upper limit of the Bollinger Bands, a common indicator of a potential downward correction. Selling pressure has intensified, supported by key technical indicators such as the Moving Average (MA) and Stochastic Oscillator, both of which confirm a bearish outlook.
The Moving Average indicates that the price is trading below the average level, reflecting the dominance of selling pressure in the market. Meanwhile, the Stochastic Oscillator has sharply declined from the overbought zone and shows a downward crossover, suggesting a potential decline may occur shortly.
Recommended
Recommended
Recommended
Recommended

On the 15-minute chart, Gold exhibits bearish signals as it has successfully breached the lower boundary of the Bollinger Bands, indicating that selling opportunities are continuing. Should this scenario unfold as anticipated, the price of Gold could decline towards the support level at 2,602.00.
Technical Reference: Sell if below 2,632.00
Potential Stop Loss 1: 2,628.00
Potential Stop Loss 2: 2,632.00
Potential Take Profit 1: 2,606.00
Potential Take Profit 2: 2,602.00


