

The Nasdaq is displaying a robust upward trend on the 1-hour timeframe. This is evident from the price pattern, which consistently forms higher highs and higher lows. This indicates that buyers continue to exert control over the market, propelling prices upward. As long as prices remain above the support line that follows the price movements, the likelihood of continuing this upward trend remains highly favorable. Even during minor price corrections, many traders seize the opportunity to buy back in.
Technical indicators also reinforce this bullish scenario. The Zigzag indicator illustrates a neat upward pattern, while the Moving Average (MA) is trending upwards, serving as support from below. Both indicators confirm that the upward direction is still robust. In the absence of significant news that could incite panic in the market, the Nasdaq is likely to maintain its strength and potentially reach new all-time highs in the near future.
Recommended

Recommended

Recommended

Recommended
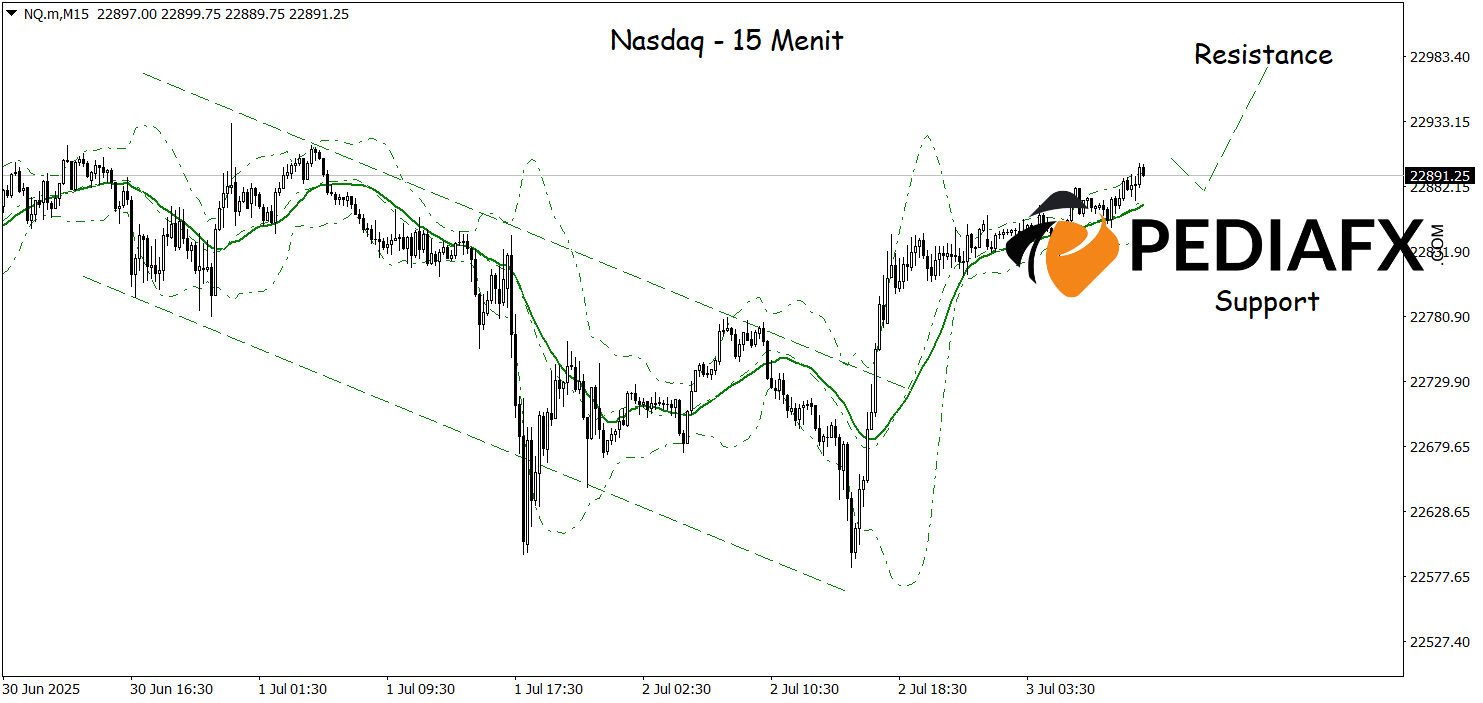
On the 15-minute timeframe, the Nasdaq’s movement indicates a breakout from the previously constraining bearish channel. The sharp surge accompanied by a breakthrough of the upper channel and the moving average line signifies an increase in buying pressure in the short term. This price jump has effectively lifted the Nasdaq out of the support area, paving the way for a continued rally toward the next resistance zone. As long as prices maintain their position above the breakout area, bullish opportunities remain wide open, potentially testing the 22,975 mark.
Technical Reference: buy as long as above 22,800
Potential Take Profit 1: 22,945
Potential Take Profit 2: 22,975
Potential Stop Loss 1: 22,835
Potential Stop Loss 2: 22,800


