

GBPUSD has demonstrated a notable strengthening after a recovery from its lowest levels in the past week. The continuous upward price movement and the formation of a higher high and higher low (HH-HL) pattern clearly indicate that buyers are currently in control of the market. This structural shift signals a trend change from a consolidation phase to a bullish direction. The rising pattern aligns with the movements of the ZigZag indicator, which is beginning to establish an uptrend, reinforcing the buying momentum that is pushing prices to higher levels.
Regarding technical indicators, the Moving Average (MA) appears to be flattening, but its tendency still leans towards a bullish outlook, providing additional support for potential price increases. Meanwhile, the CCI, which was previously in the oversold area, is starting to rebound, signaling further upward opportunity. With this combination of signals, GBPUSD is likely to continue its strength in the European session to test the nearest resistance, especially if buyers can maintain their buying pressure above key support levels.
Recommended

Recommended

Recommended

Recommended
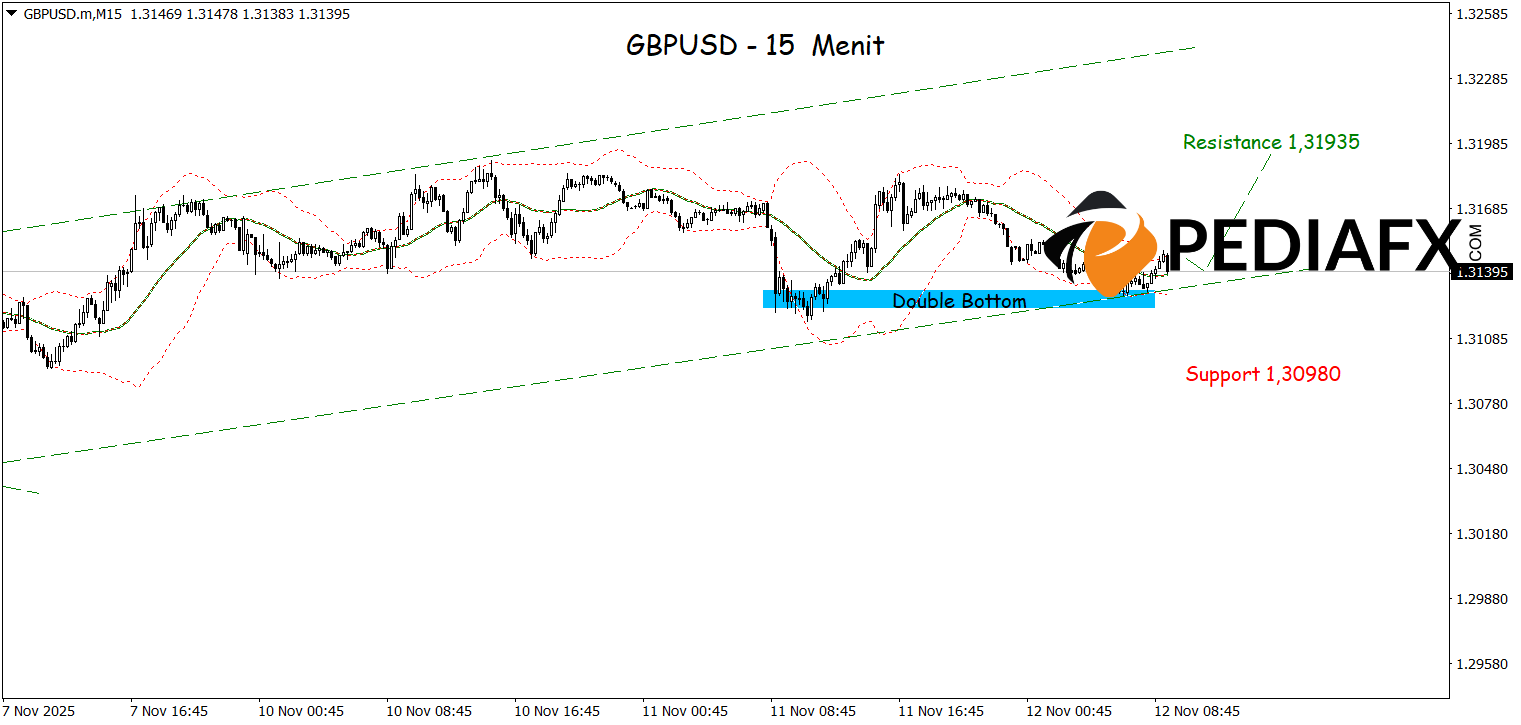
GBPUSD is showing potential for further strengthening as prices move within a bullish channel on the 15-minute chart. The rebound from the lower Bollinger Bands (BB), combined with the formation of a double bottom pattern, indicates that buying pressure is beginning to increase. This technical pattern suggests a potential reversal phase from the previous weakness. With the supportive price structure strengthening and the developing bullish momentum, GBPUSD has a chance to continue rising and test the significant resistance area at 1.31935.
Technical Reference: buy above 1.30980
Potential Take Profit 1: 1.31765
Potential Take Profit 2: 1.31935
Potential Stop Loss 1: 1.31155
Potential Stop Loss 2: 1.30980


