

The price of Gold (XAUUSD) experienced significant volatility during trading on Wednesday and this trend may continue into today, Thursday (January 30, 2025). An analysis of the one-hour chart reveals an upward trend (shown in green), but the Stochastic indicator is demonstrating bearish divergence, suggesting a potential short-term correction.
The phenomenon of bearish divergence occurs when the price charts create a higher high while the Stochastic indicator forms a lower high (illustrated by the red line).
Recommended

Recommended

Recommended

Recommended
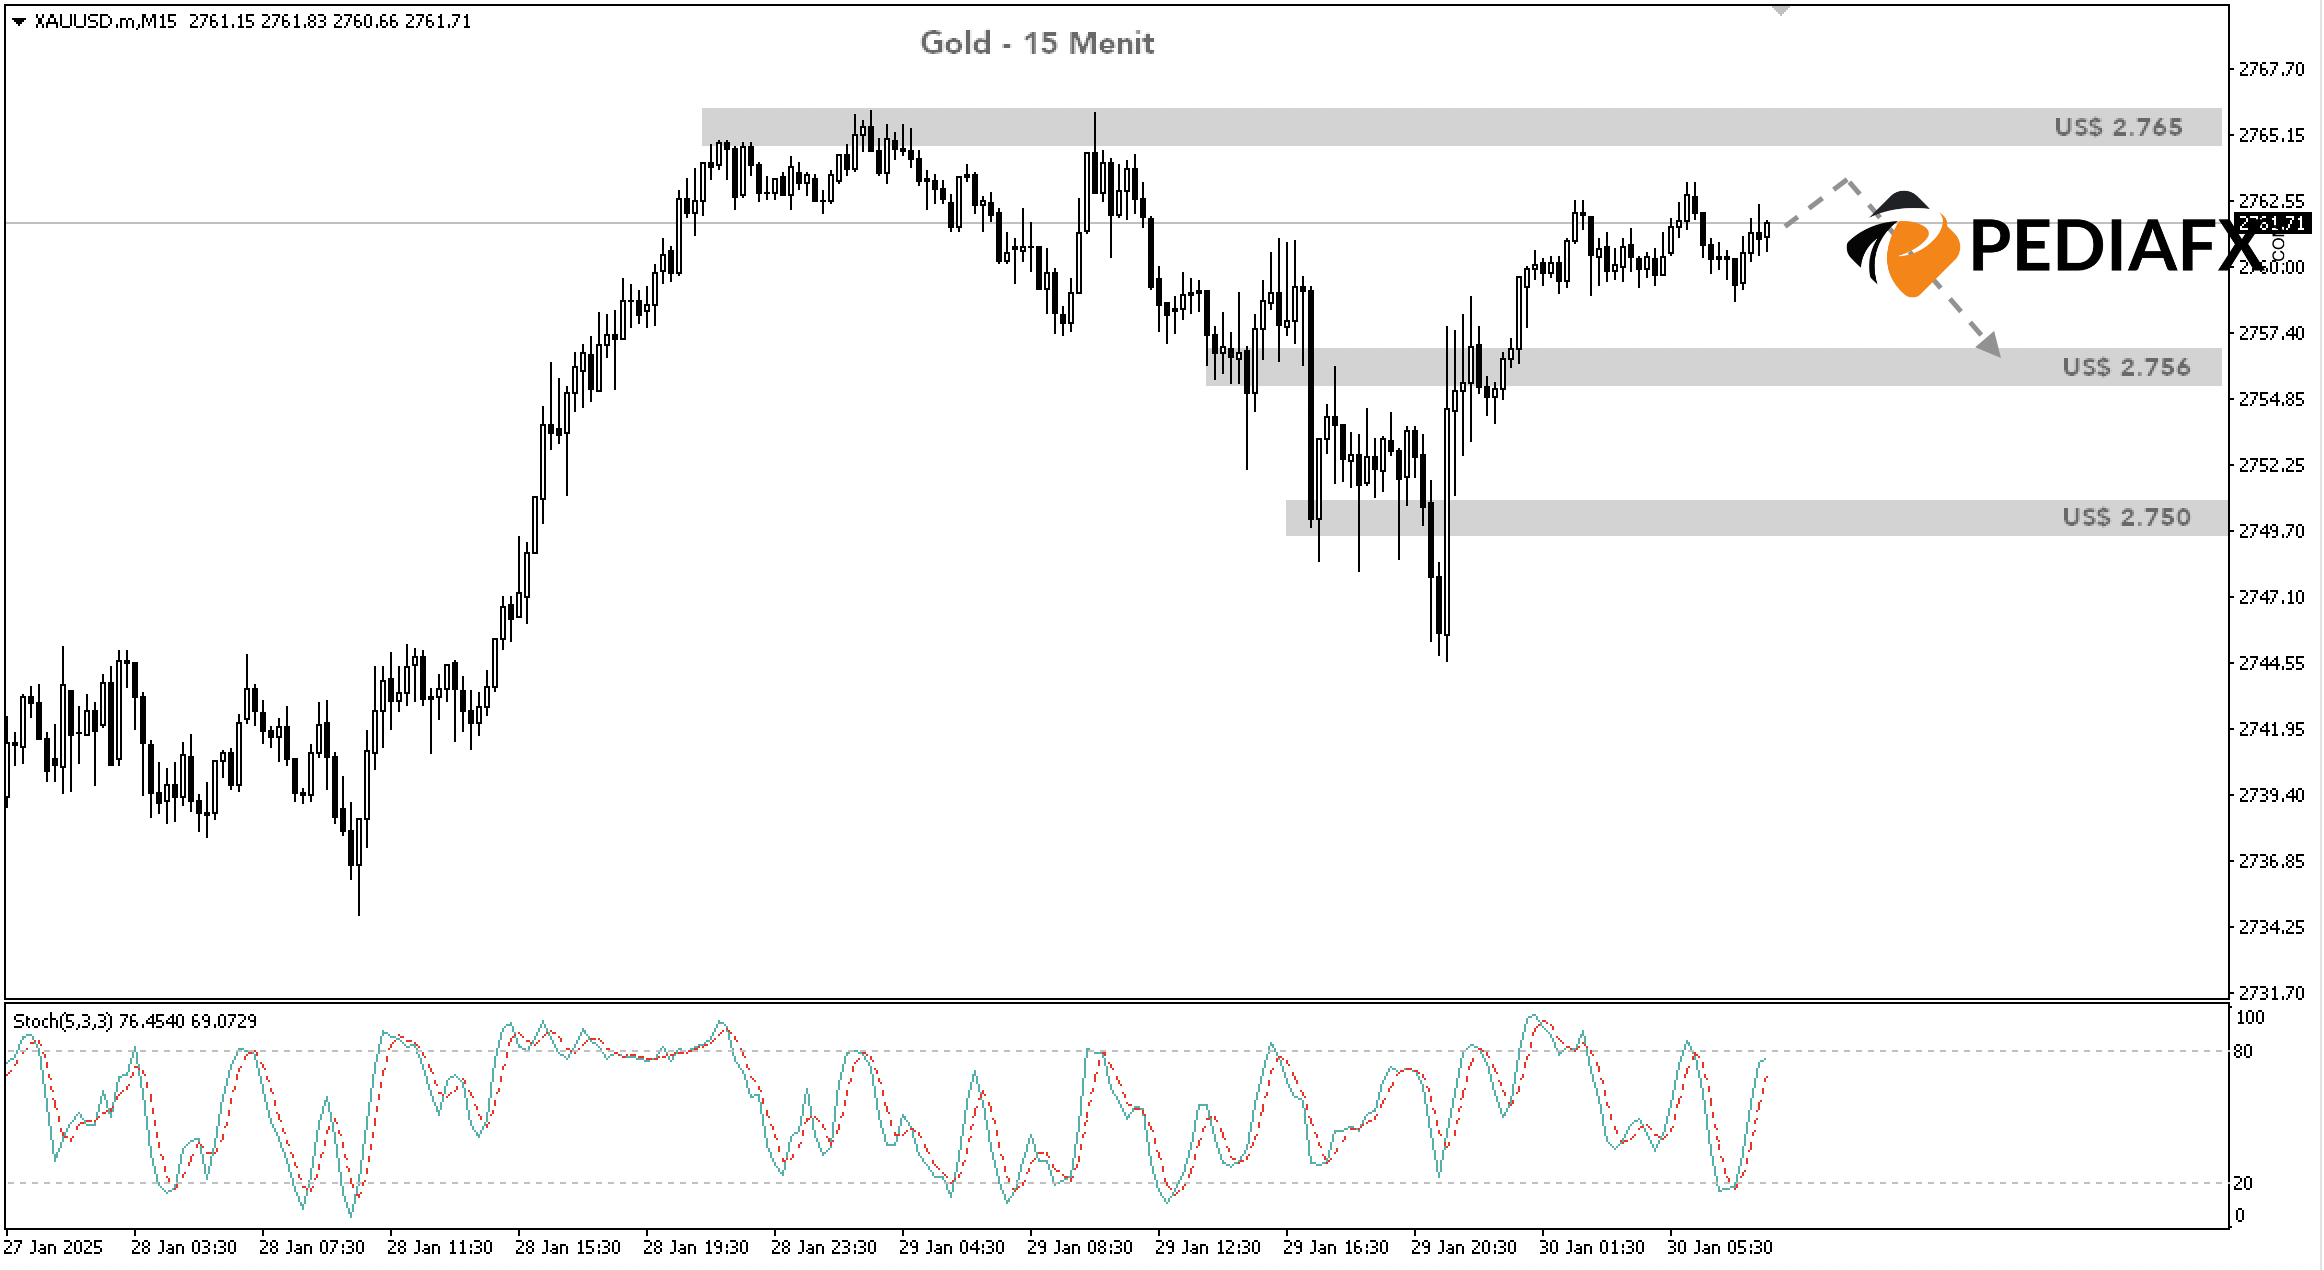
On the 15-minute chart, the Stochastic indicator is on the rise and approaching the overbought territory. This indicates a limited short-term increase in Gold prices but raises the possibility of a decline if the Stochastic indicator crosses into the overbought region.
As long as it does not break the nearest resistance around US$ 2,765, Gold remains poised for a short-term decline.
Technical references: sell if below US$ 2,765
Potential Take Profit 1: US$ 2,756
Potential Take Profit 2: US$ 2,750
Potential Stop Loss 1: US$ 2,765
Potential Stop Loss 2: US$ 2,770


