

The Nasdaq has once again faced significant selling pressure as the price has successfully broken below the lower boundary of the bullish channel on the 1-hour time frame. This breakout serves as a critical technical signal that the prior uptrend has lost its momentum. The declining Moving Average (MA) line reinforces the downward direction, reflecting the sellers’ dominance in recent sessions. This weakening price structure presents considerable opportunities for the market to continue a deeper correction.
Moreover, the MACD indicator has now entered negative territory, with the histogram expanding further downwards, indicating a growing bearish momentum. As a result, selling opportunities in the market become increasingly attractive for traders looking for ongoing downward momentum. Supported by price patterns, the direction of the MA, and aligned MACD signals, the Nasdaq is poised to continue its decline and test the next support level at a lower range.
Recommended

Recommended

Recommended

Recommended
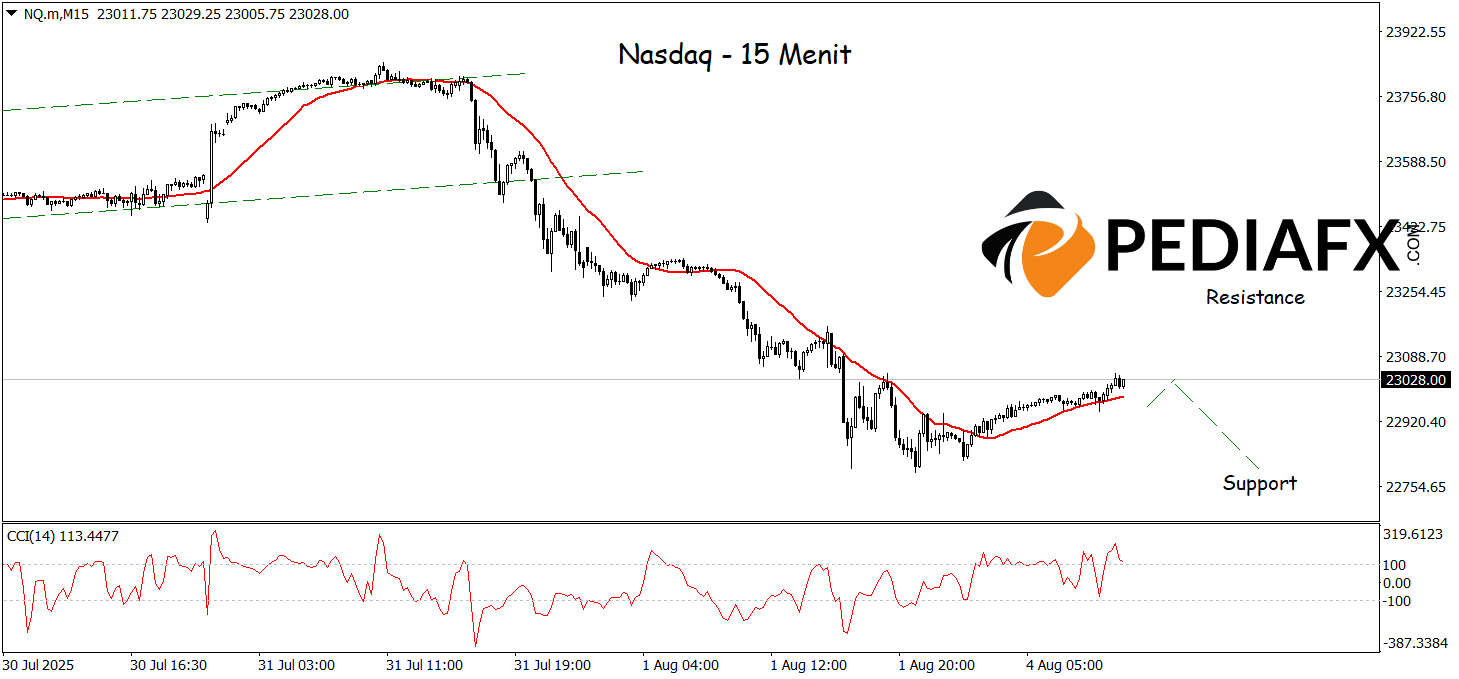
The Nasdaq displays signs of continued weakness on the 15-minute time frame after the price has successfully broken below the bullish channel, indicating the growing dominance of selling pressure. The Moving Average (MA) line continues to trend downward, supporting the potential for ongoing weakness. Additionally, the CCI indicator is in overbought territory, signaling that corrective momentum could persist. With this combination of technical signals, the Nasdaq has the potential to continue its decline towards the nearest support level at 22,793.
Technical Reference: sell while below 23,215
Potential Stop Loss 1: 23,135
Potential Stop Loss 2: 23,215
Potential Take Profit 1: 22,870
Potential Take Profit 2: 22,793


