

The one-hour chart of the Nasdaq reveals a well-structured upward trend characterized by a series of higher highs (HH) and higher lows (HL) continuously forming within an ascending channel. Every time a correction occurs towards the MA or the lower boundary of the channel, strong buying pressure re-emerges, creating further upward waves. This bullish momentum is reinforced by the MACD histogram, which has consistently remained within the positive zone for an extended period, reflecting the buyers’ strong influence on the trend.
Currently, prices are in a light consolidation phase after achieving a new HH near the upper limit of the channel. If prices manage to stay above the MA and establish a new HL, the chances for continuation of the upward trend towards the next resistance area will remain favorable, especially during tonight’s US session, which often triggers increased volume and volatility. However, traders should also be cautious of potential weakness should prices break below the channel, as it could signal the start of a deeper correction. Overall, the outlook remains positive as long as the HH-HL structure is maintained.
Recommended

Recommended

Recommended

Recommended
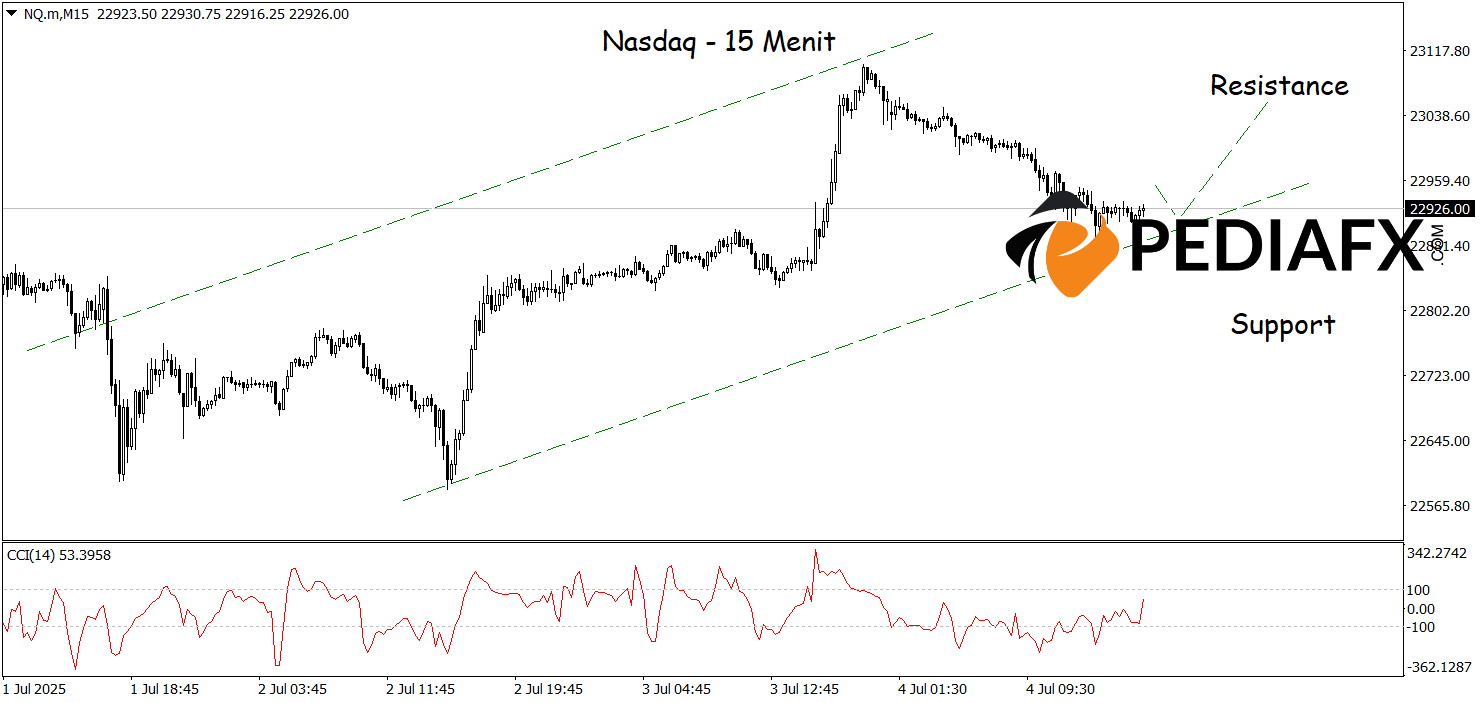
Meanwhile, on the 15-minute chart, the bullish channel indicates the dominance of buyers in the short term, with prices consistently forming higher highs and higher lows. Despite a brief correction, the CCI indicator is now in the oversold territory, signaling a potential upward rebound as selling pressure eases. This technical signal further strengthens the chances for the Nasdaq to gain momentum in the near term, with the potential to continue its upward trend towards the resistance level of 23,050 during tonight’s US session.
Technical Reference: buy while above 22,800
Potential Take Profit 1: 23,000
Potential Take Profit 2: 23,050
Potential Stop Loss 1: 22,850
Potential Stop Loss 2: 22,800


