

The 1-hour chart of Nasdaq depicts a consistent upward trend characterized by the formation of higher highs (HH) and higher lows (HL) neatly contained within a parallel ascending channel. Every price correction towards the EMA or lower channel is met with robust buying activity, giving rise to a new wave of increases. This bullish momentum is further supported by the MACD histogram remaining positively skewed for an extended period, indicating a steady trend push from the buyers’ side.
Currently, the price is undergoing a gentle consolidation phase after notching a new HH near the upper boundary of the channel. If the price can maintain its position above the EMA while establishing a new HL, there is significant potential for the upward trend to continue towards the next resistance area. However, traders should also stay alert to the possibility of weakness if the price breaks down below the channel, which could signal a deeper retracement. Overall, the outlook remains optimistic as long as the HH-HL structure holds firm.
Recommended

Recommended

Recommended

Recommended
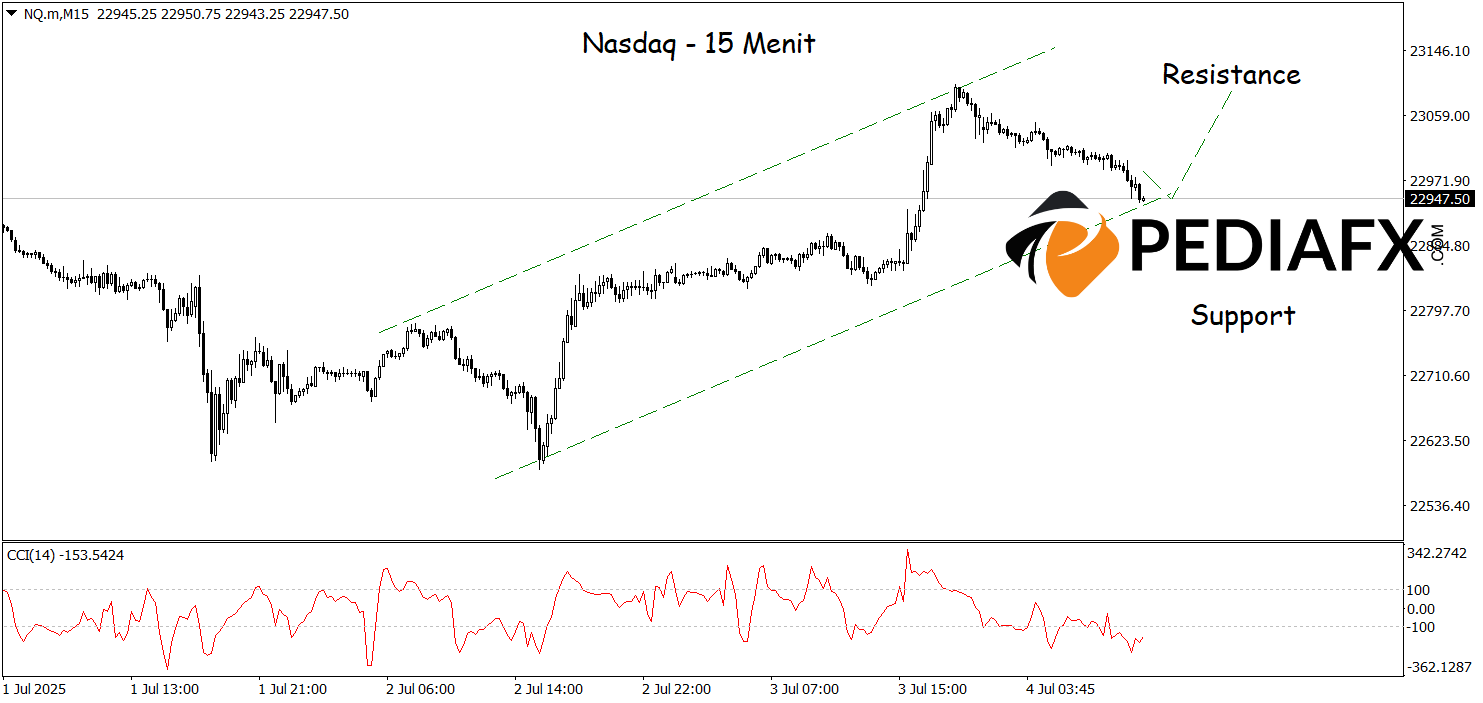
The bullish channel formed on the 15-minute Nasdaq chart indicates buyer dominance in the short-term movement, with the price continually achieving higher highs and higher lows. Although a correction occurred, the CCI indicator is currently in the oversold region, signaling a potential upward rebound as selling pressure begins to ease. This technical signal reinforces the likelihood of a Nasdaq resurgence in the near future, with the potential to continue the upward trend to test the 23,090 resistance level.
Technical Reference: buy while above 22,800
Potential Take Profit 1: 23,055
Potential Take Profit 2: 23,090
Potential Stop Loss 1: 22,838
Potential Stop Loss 2: 22,800


