

The Nasdaq’s movement on the 1-hour time frame indicates a strengthening upward trend, with a consistent price structure creating Higher Highs (HH) and Higher Lows (HL). After bouncing back from the lower line of the ascending channel, the price has continued to rise, now reaching a fresh HH around 22,417. This technical framework highlights an increasing dominance of buyers, especially following the confirmation of the last HL formation, which serves as a strong base for further upward movements.
Support from the MACD indicator bolsters the ongoing uptrend signal. The MACD histogram is positioned above the zero line and is showing significant strength, which reflects a growing buying momentum. Additionally, the Moving Average line is also rising, backing the price movement within the bullish channel. As long as the HH-HL structure remains intact and the price sustains above the midline of the channel, the prospects for Nasdaq to continue strengthening remain highly favorable.
Recommended

Recommended

Recommended

Recommended
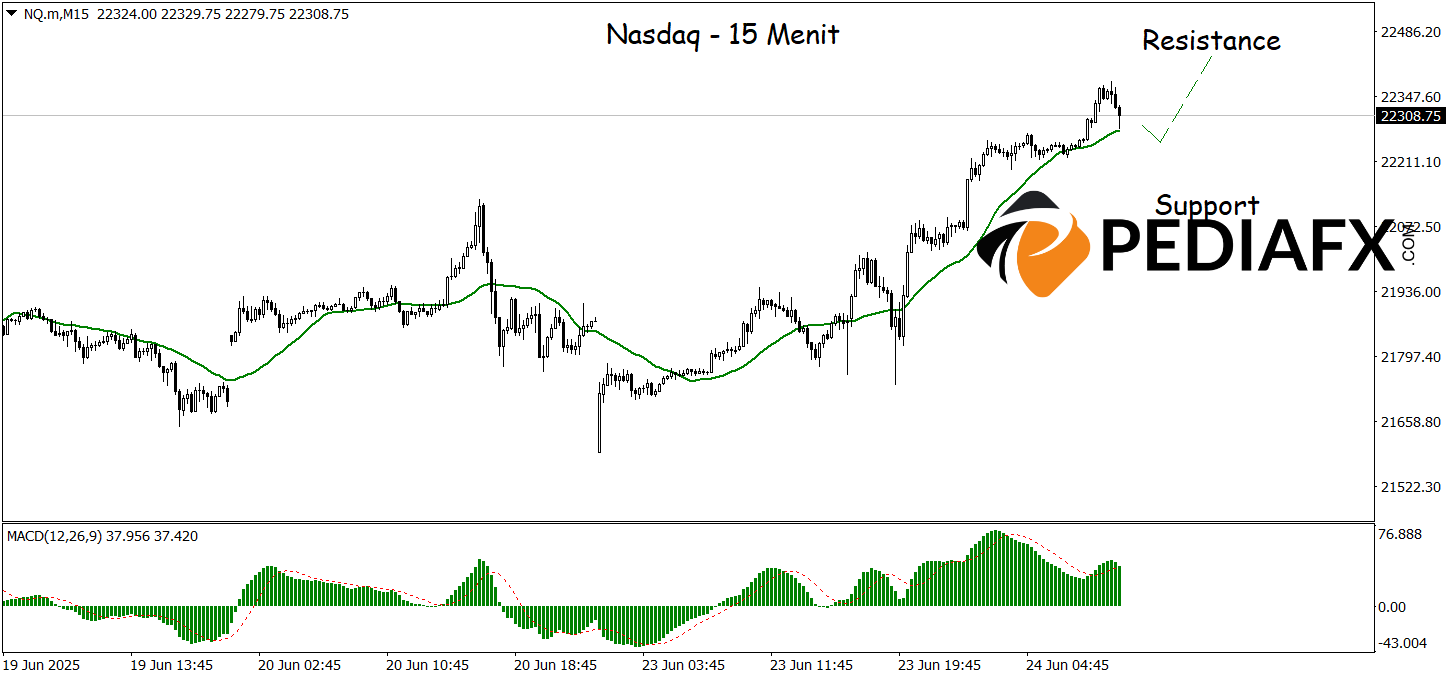
The Nasdaq shows continued potential for an uptrend on the 15-minute time frame, supported by increasingly robust technical signals. The Moving Average (MA) line is sharply trending upward, signifying a strengthening short-term trend. Meanwhile, the MACD indicator is also positively positioned above the zero line, indicating the ongoing development of buying momentum. The combination of these two indicators provides a confirmatory signal that the Nasdaq is poised to continue its ascent soon, with potential to test the resistance level at 22,440.
Technical Reference: buy above 22,157
Potential Take Profit 1: 22,393
Potential Take Profit 2: 22,440
Potential Stop Loss 1: 22,207
Potential Stop Loss 2: 22,157


