

The Nasdaq index is likely poised for a correction after encountering resistance at the upper boundaries of the Bollinger Bands, suggesting a challenging resistance level. This rejection indicates that the index has entered an overbought zone, which is typically followed by selling pressure. Additionally, the Stochastic indicator is signaling an oversold condition, reinforcing the likelihood of a reversal in the near future.
This blend of technical signals serves as a warning for traders to prepare for a potential correction. With the upward momentum beginning to fade, the Nasdaq may decline towards the next support level.
Recommended

Recommended

Recommended

Recommended
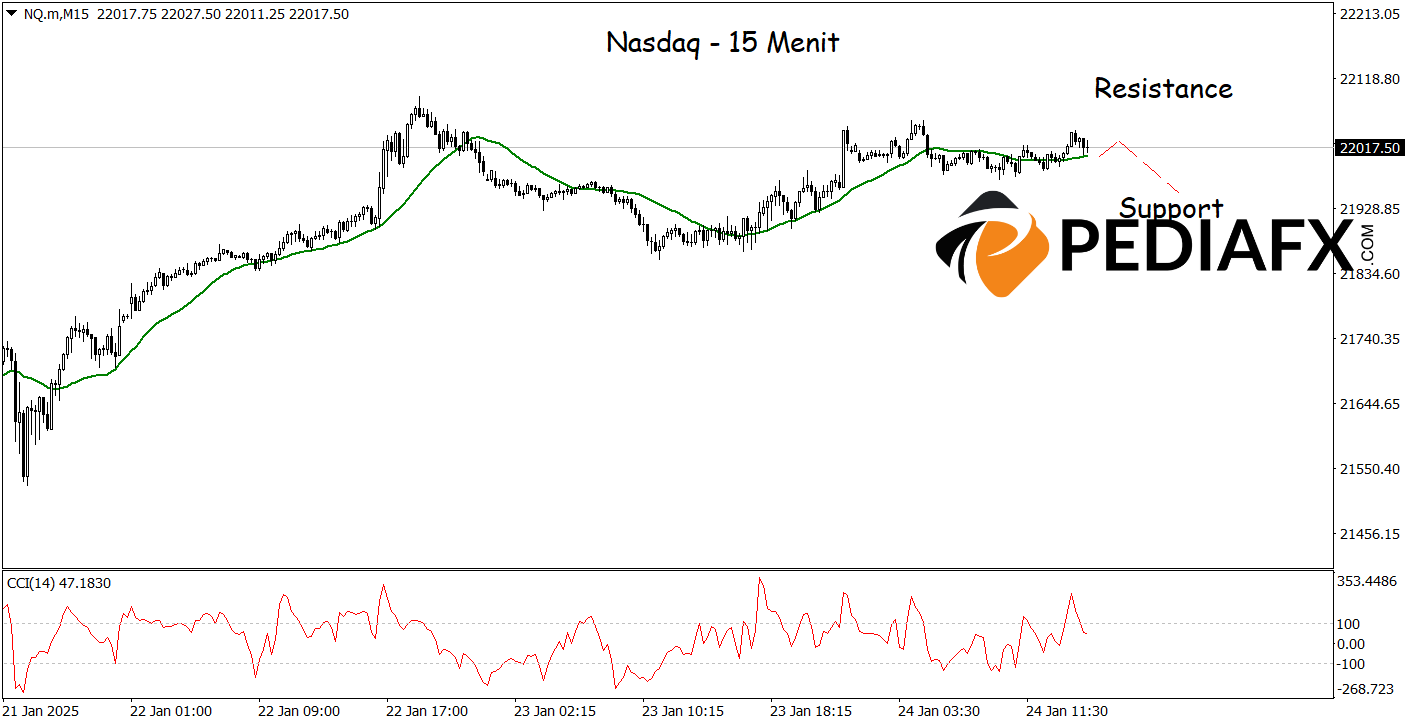
The Nasdaq is displaying signs of a potential correction on the 15-minute chart as the Moving Average (MA) indicator consistently signals a downward trend. Price movements below the MA line emphasize the prevailing selling pressure in the market. Furthermore, the Commodity Channel Index (CCI), which is starting to drop from an overbought level, provides additional confirmation that further declines may be on the horizon. The combination of these two indicators suggests a correction opportunity aiming towards the 21,948 level.
Technical Reference: sell while below 22,080
Potential Stop Loss 1: 22,048
Potential Stop Loss 2: 22,080
Potential Take Profit 1: 21,980
Potential Take Profit 2: 21,948


