

The Nasdaq has been exhibiting a robust upward trend, characterized by a sharply rising Moving Average (MA) line. This increase indicates a consistent buying strength, propelling prices to maintain movement within a formed upward channel. The stable price movements above the MA send a technical signal that the bullish trend remains dominant, with the potential for ongoing rallies as long as there is no significant pushback from sellers.
Furthermore, the MACD indicator reinforces this upward scenario with a positive crossover and a histogram that consistently registers values above the zero line. These conditions suggest that buying momentum has not wavered and continues to support upward movements in the short to medium term. As long as this technical structure remains intact, the Nasdaq is likely to test the next resistance level and could even reach new highs.
Recommended

Recommended

Recommended

Recommended
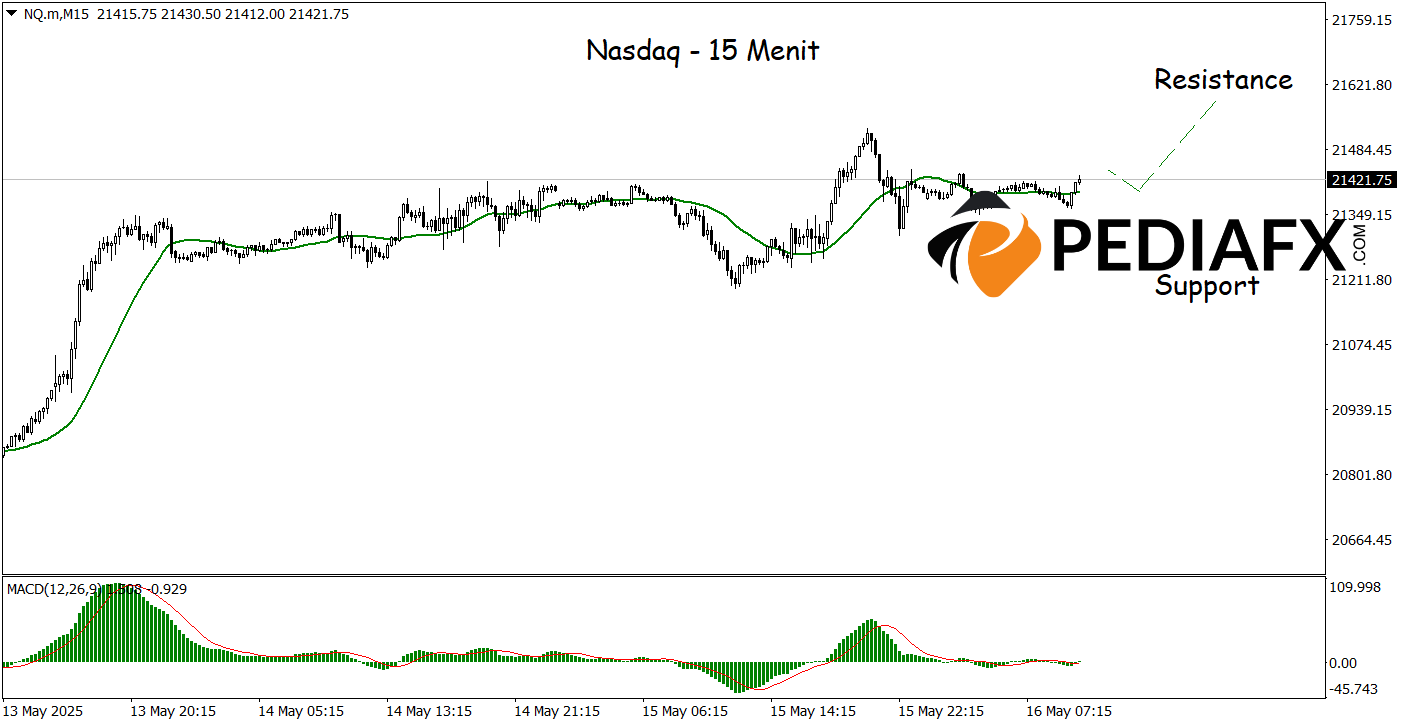
The Nasdaq displays a valid uptrend structure on the 15-minute timeframe, evidenced by a consistent pattern of higher highs and higher lows. The Moving Average (MA) continues to rise, supporting the trend’s direction, while the MACD indicator reinforces bullish momentum with the MACD line situated above the signal line and the histogram showing positive values. This combination of three technical elements indicates that buying pressure remains dominant, creating opportunities for the Nasdaq to continue its ascent towards the 21,600 level.
Technical Reference: buy while above 21,265
Potential Take Profit Level 1: 21,540
Potential Take Profit Level 2: 21,600
Potential Stop Loss Level 1: 21,333
Potential Stop Loss Level 2: 21,265


