

The movement of the Nasdaq on the hourly chart reflects a market structure that remains in a strong upward trend, characterized by a series of higher highs (HH) and higher lows (HL). The ascending channel established since late June suggests that buyer strength continues to dominate. Despite a temporary correction within a downward consolidation pattern (marked by the red line), the price has bounced back from the last HL area and successfully broken out of the downward pattern. This breakout provides a signal that the upward trend is likely to continue.
Support from the CCI indicator, which is significantly above the 100 level, reinforces the potential for the continuation of the bullish trend. The CCI indicates high buying momentum, suggesting price acceleration upwards following the consolidation phase. As long as the higher low structure remains intact, bullish opportunities are still wide open.
Recommended

Recommended

Recommended

Recommended
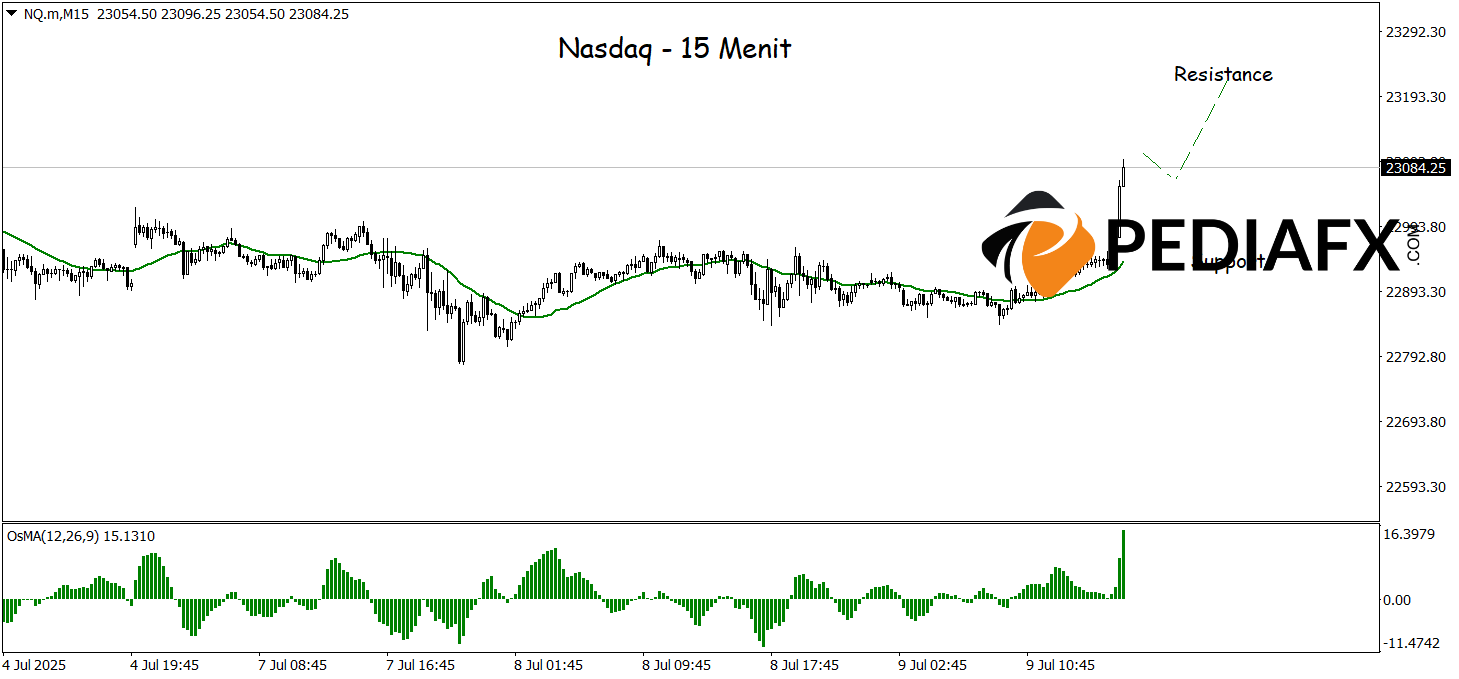
On the 15-minute time frame, the Nasdaq shows potential for a comeback as the Moving Average (MA) climbs above the current price, indicating that buying pressure is beginning to materialize from lower levels. Moreover, the OSMA indicator, which is in positive territory, further confirms the presence of an emerging upward momentum. With this technical backing, Nasdaq has the potential to continue its rally and test the psychological resistance at the 23,210 level in the near term, particularly if significant selling pressure does not emerge in that area.
Technical Reference: buy as long as above 22,950
Potential Take Profit 1: 23,160
Potential Take Profit 2: 23,210
Potential Stop Loss 1: 23,000
Potential Stop Loss 2: 22,950


