

The Nasdaq on the 1-hour time frame reveals technical signals pointing to a continued decline following a successful break low from the previously established bearish channel. This break signifies the conclusion of the consolidation phase and suggests that selling pressure is starting to reassert itself in the market.
The weakness signal is further validated by the MACD indicator, which is currently situated in the negative territory, with the histogram consistently recording lower values and the MACD line remaining below the signal line. This indicates that selling pressure remains robust, and the chances for a rebound are still limited until a valid reversal signal appears. As long as the Nasdaq does not reclaim the MA line and the channel area that has been breached, the possibility of a decline toward the next technical support remains on the table.
Recommended

Recommended

Recommended

Recommended
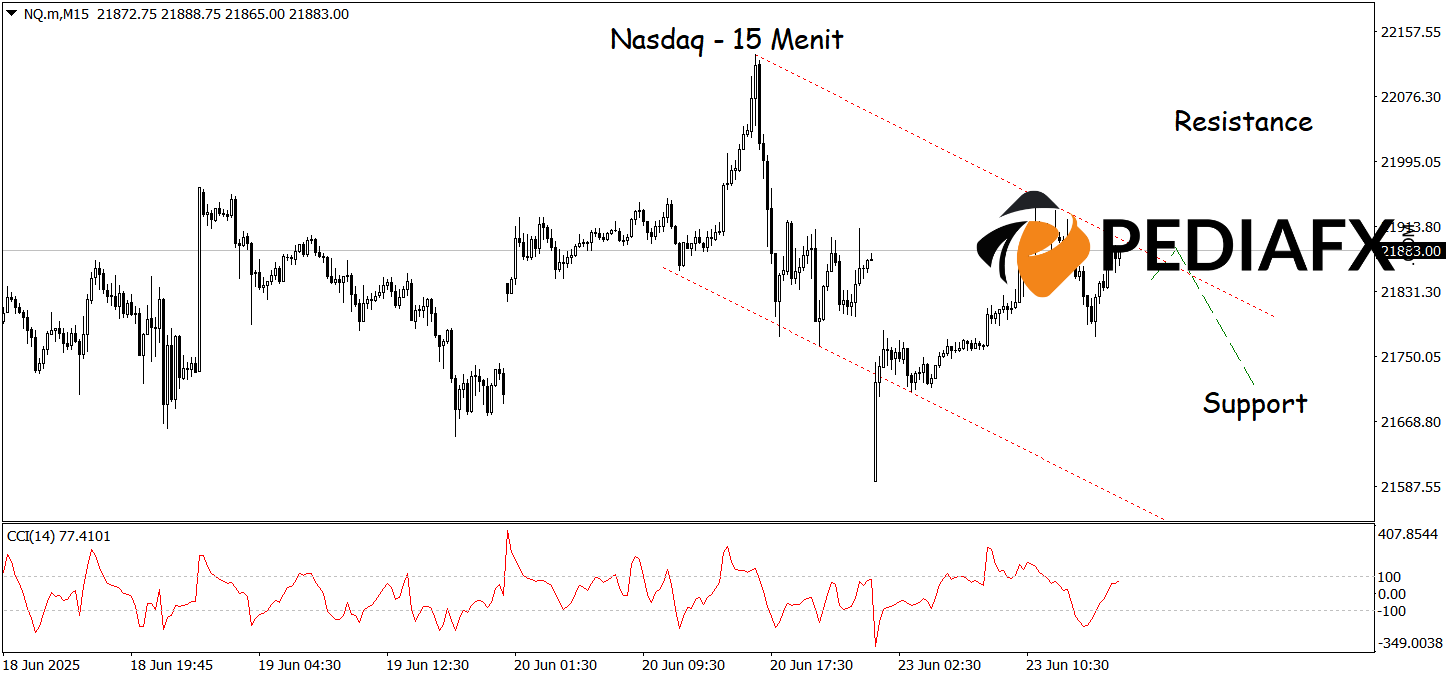
On the 15-minute time frame, Nasdaq is beginning to create a bearish channel, indicating a shift in the short-term trend from neutral to downward. The price action has started to consistently make lower highs and lower lows, reinforcing the likelihood of further weakness. Additionally, the CCI indicator is currently approaching the overbought region, signaling that buying pressure is starting to weaken and opening the door for a price correction to test support at 21,708.
Technical Reference: sell below 22,028
Potential Stop Loss 1: 21,985
Potential Stop Loss 2: 22,028
Potential Take Profit 1: 21,782
Potential Take Profit 2: 21,708


