

The GBPUSD currency pair is facing increasing selling pressure after successfully breaching the support level of the ascending triangle pattern on the 1-hour time frame. This breakout indicates a significant signal that the prior bullish structure has collapsed, confirming the persistence of seller dominance in the market. Typically, a break of support in such patterns suggests a decisive change in direction, and in the case of GBPUSD, this scenario opens the door for further weakness. The market currently adopts a defensive stance, with buyers struggling to maintain momentum.
The bearish pressure is further bolstered by technical indicators pointing uniformly downwards. The moving averages are trending downward, zigzag patterns indicate sharp declines, and the MACD remains in negative territory, adding confirmation that the downward trend is still firmly established. The combination of these three indicators reveals a prevailing market sentiment that is bearish, with ample room for continued declines. If these technical conditions persist without any positive catalysts, GBPUSD may be poised for further descent in the upcoming trading sessions.
Recommended

Recommended

Recommended

Recommended
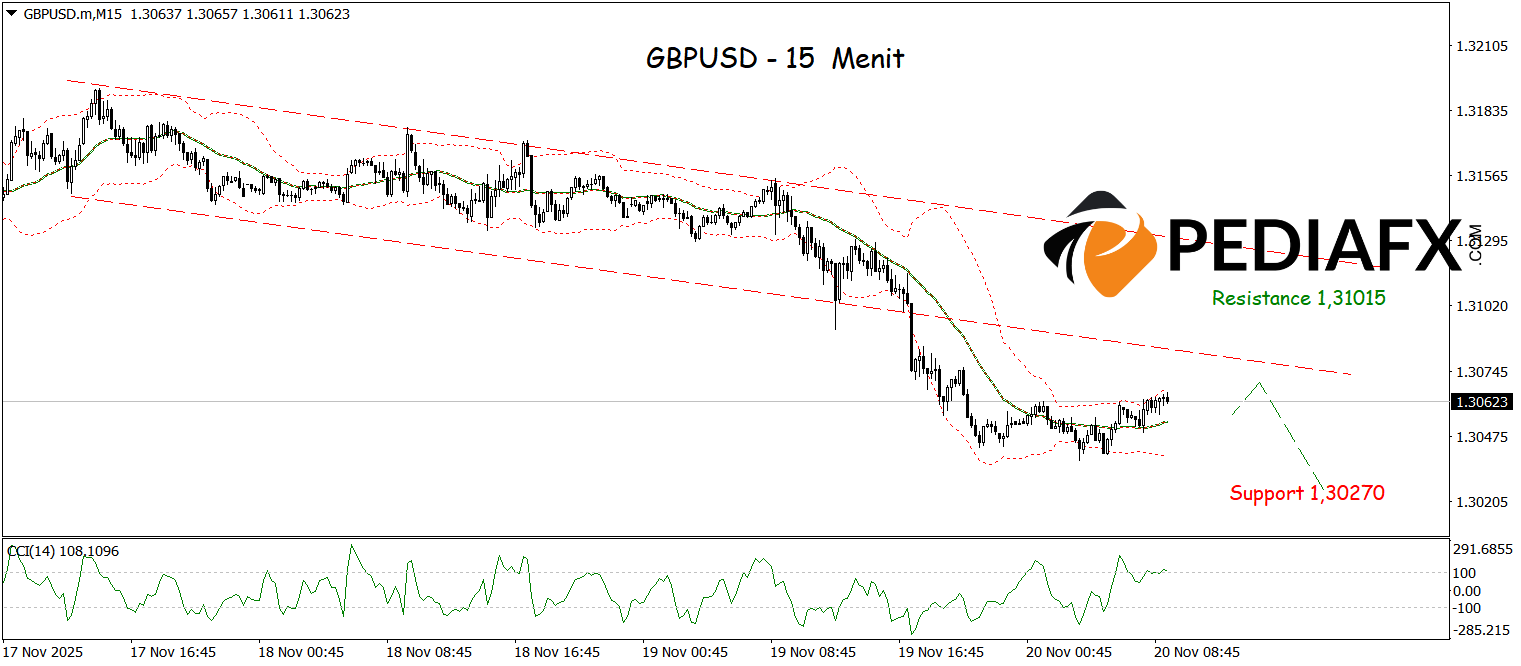
Breaking the low area of the bearish channel strengthens the notion that declines in GBPUSD on the 15-minute time frame will continue. Currently, the price is also restrained at the Bollinger Bands resistance zone, indicating that selling pressure is resurfacing after a brief pullback. Additionally, the CCI indicator is in overbought territory, signaling that the upward momentum has weakened and is ready to reverse direction. With this combination of factors, GBPUSD is likely to continue its decline and test important support levels at 1.30270.
Technical Reference: sell while below 1.31015
Potential Stop Loss 1: 1.30875
Potential Stop Loss 2: 1.31015
Potential Take Profit 1: 1.30420
Potential Take Profit 2: 1.30270


