

The Nasdaq is beginning to reveal signs of recovery as prices attempt to break through the upper boundary of a minor bearish channel that has been capping upward movement. Patterns from the ZigZag indicator are starting to suggest a potential formation of higher lows, while the Moving Average (MA) line is also bending upward, supporting the possibility of a trend direction change. This technical signal fosters hope that selling pressure has waned and buyers are gradually regaining control.
Additional confidence in the potential for a rebound is provided by the Commodity Channel Index (CCI), which is currently in oversold territory, historically often marking the beginning of price reversals. The combination of these technical patterns and the oversold condition lays a solid foundation for a bullish scenario in the short term. If the Nasdaq can maintain its position above the bearish channel and continue its ascent, the likelihood of testing significant resistances next will increase substantially.
Recommended

Recommended

Recommended

Recommended
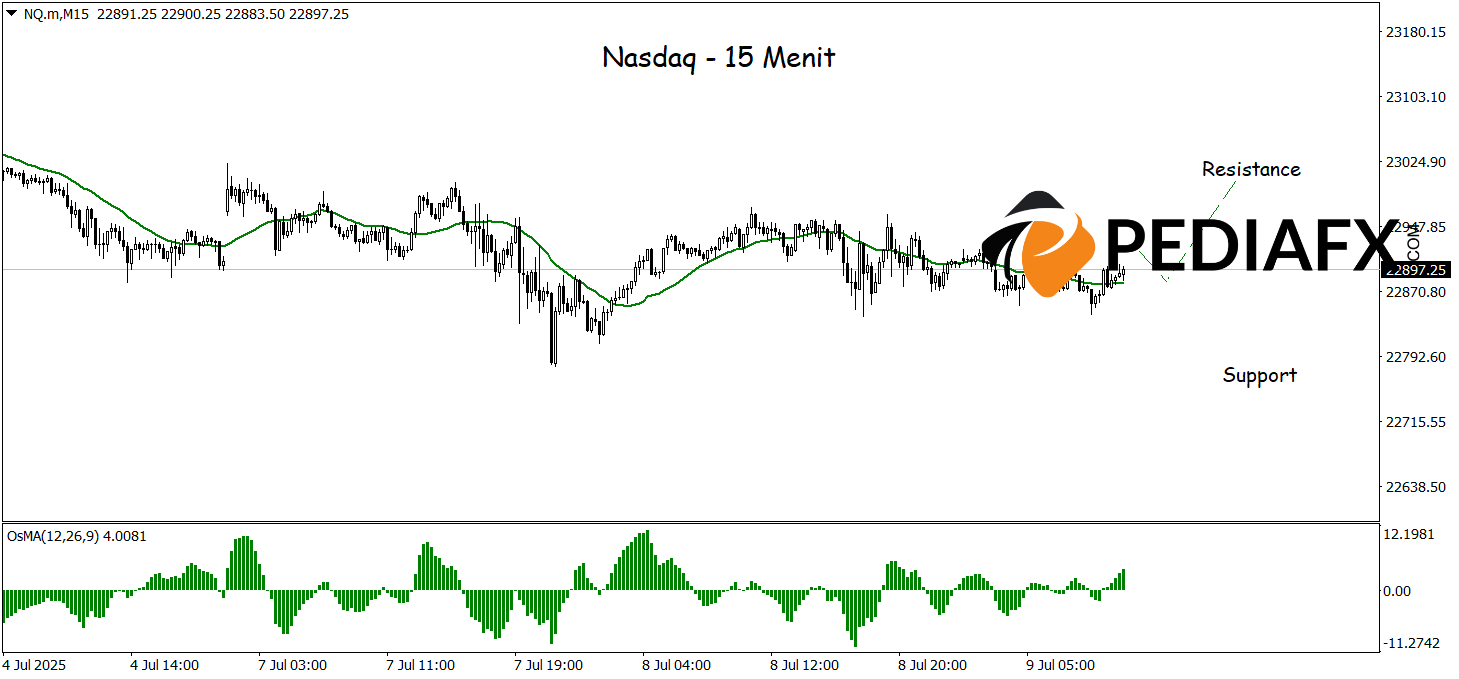
On the 15-minute time frame, the Nasdaq indicates the potential for a resurgence as the Moving Average (MA) line is positioned above the current price, signaling that buying pressure is beginning to form from lower levels. Moreover, the OSMA indicator, which is also in positive territory, confirms the development of upward momentum. With this technical support, the Nasdaq has the opportunity to continue its strengthening and test the psychological resistance at the 23,000 level in the near future, particularly if no significant selling pressure emerges in that area.
Technical References: buy while above 22,780
Potential Take Profit 1: 22,965
Potential Take Profit 2: 23,000
Potential Stop Loss 1: 22,820
Potential Stop Loss 2: 22,780


