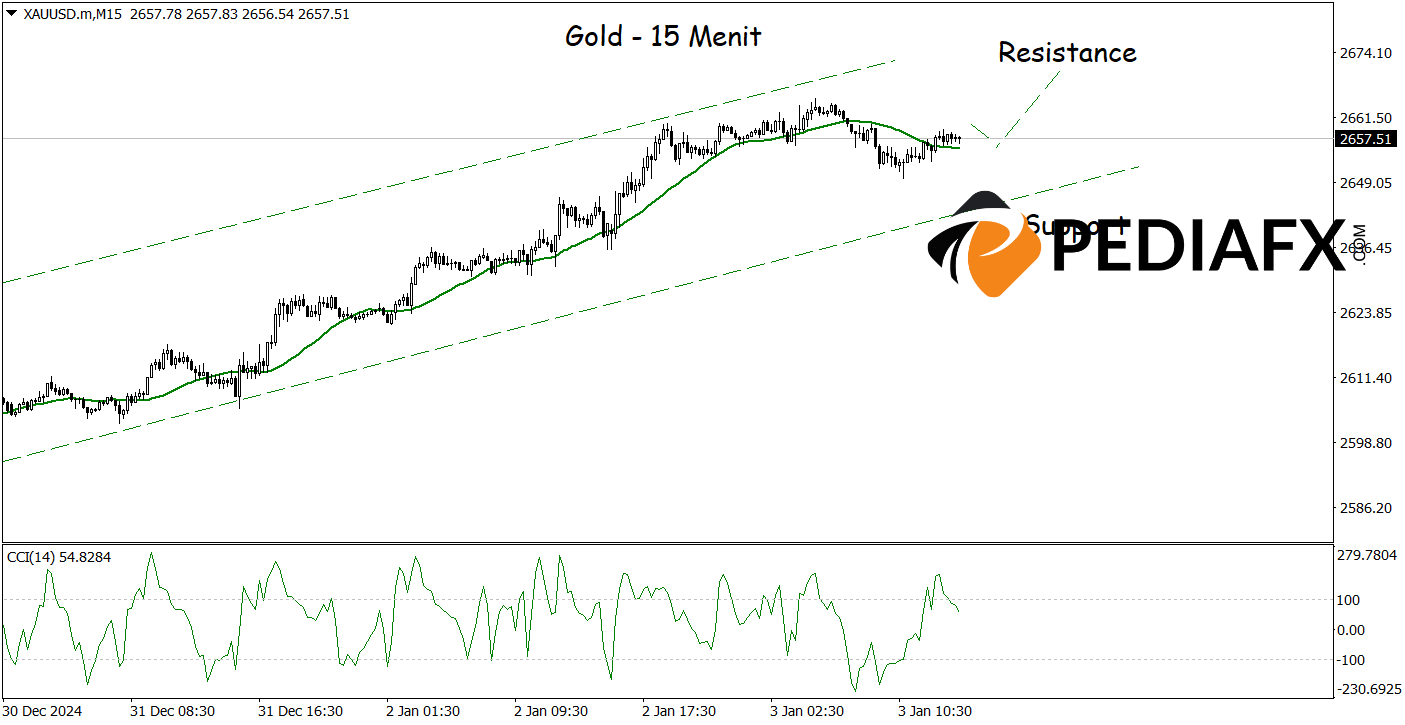
The price of gold appears to have the potential to continue its bullish momentum, backed by confirmations from the Moving Average (MA) and MACD indicators, both indicating possible further increases. The MA suggests that the upward trend remains strong, while the MACD bolsters this outlook with a positive histogram and the MACD line positioned above the signal line.

Recommended
Recommended
Recommended
Recommended
In the 15-minute chart above, gold also continues to display bullish potential as it forms a bullish channel, while the CCI starts to rebound from an oversold condition. If the scenario holds, gold may rise towards the resistance level of $2,670.00 per troy ounce.
Technical Reference: buy as long as it stays above 2,643.00
Potential Take Profit 1: 2,664.00
Potential Take Profit 2: 2,670.00
Potential Stop Loss 1: 2,650.00
Potential Stop Loss 2: 2,643.00


