

Gold has been trading within a limited range during the European session, yet it continues to follow a bullish trajectory. The price has been stuck near the lower area of the Bollinger Bands, while the bullish Higher High (HH) and Higher Low (HL) structures on the hourly chart have not been broken downward. This situation indicates that the bullish momentum remains intact, and the selling pressure is insufficient to reverse the market direction.
Furthermore, the ZigZag indicator is forming an upward pattern, reinforcing the signal that Gold may experience a rebound in the near future. With this technical combination in play, the possibility for Gold to strengthen remains open, potentially testing the nearest resistance area again. The current consolidation phase may serve as an accumulation period before further price increases occur.
Recommended

Recommended

Recommended

Recommended
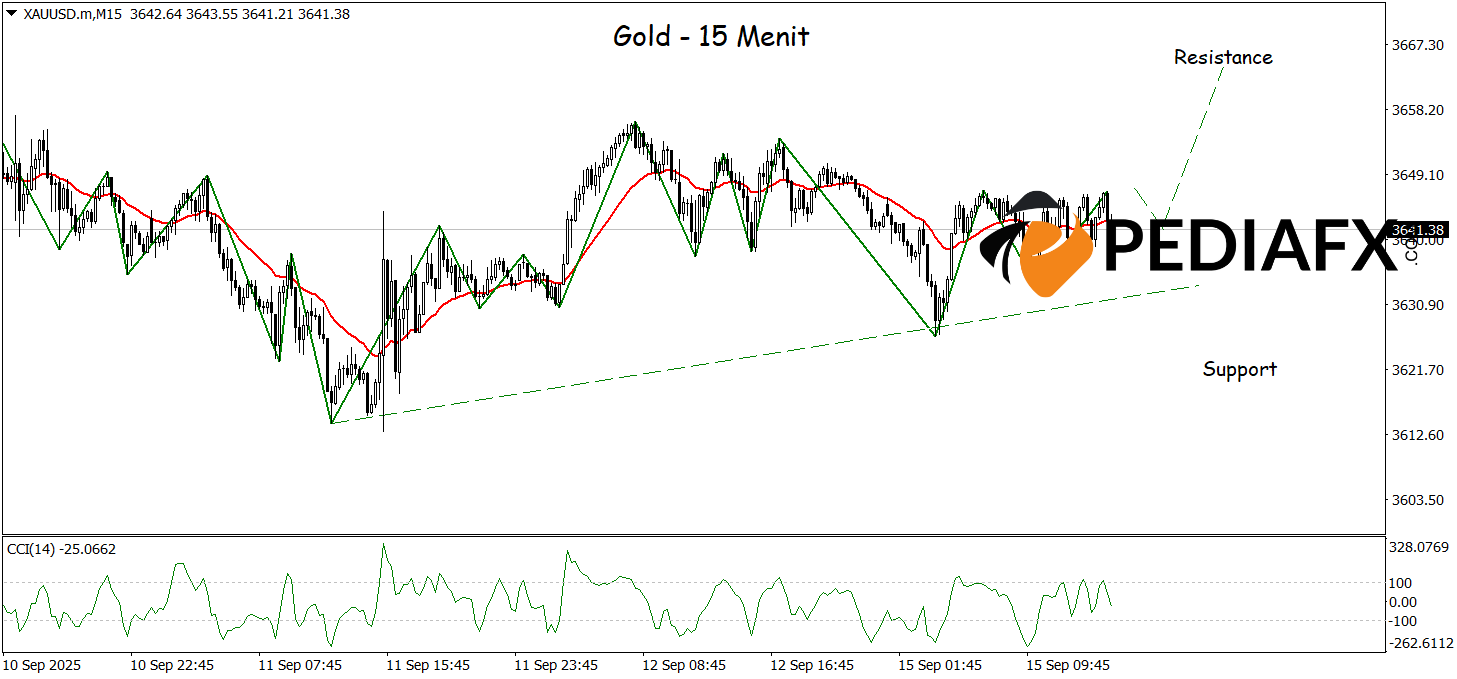
On the 15-minute chart, Gold displays a clear bullish trend, with a rising trendline established as a foundation for the price movement. Additional support has emerged from the Moving Average (MA), which is beginning to climb, and the ZigZag indicator is also forming an upward pattern, both strengthening the outlook for further gains. This technical situation suggests that bullish momentum is maintained, allowing Gold the potential to continue rising to test the resistance area around $3,663, as long as the price does not fall below the dynamic support beneath the trendline.
Technical Reference: buy while above 3,622
Potential Take Profit 1: 3,655
Potential Take Profit 2: 3,663
Potential Stop Loss 1: 3,629
Potential Stop Loss 2: 3,622


