

The price of Gold has shown a bounce from the lower range of the Bollinger Bands indicator, indicating a market response to oversold conditions. This rise brings the price closer to the middle line (middle band) of the Bollinger, which often acts as a dynamic resistance level during a downtrend. If the price fails to break through this zone, the potential for further weakness increases as this area commonly becomes a rejection zone for a market that is still under selling pressure.
The Stochastic Oscillator indicator, currently situated in the oversold region, adds confirmation that despite a temporary rise, the potential for decline remains if significant buying momentum is absent. Traders should watch for a possible drop after reaching the middle band, as this could signal the early continuation of a downtrend.
Recommended

Recommended

Recommended

Recommended
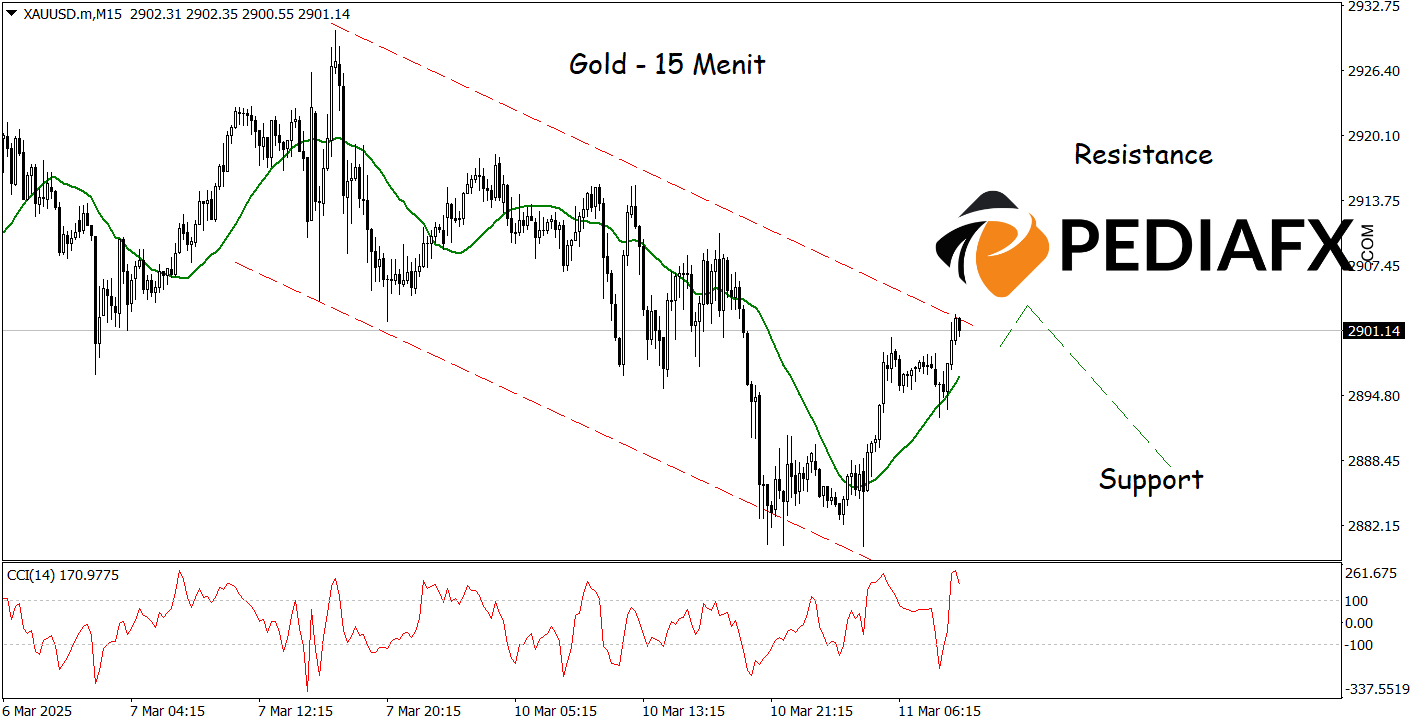
The current movement of Gold is within a bearish channel, suggesting that the downward trend is still prevalent. This pattern is characterized by a series of progressively lower peaks (lower highs) and lower troughs (lower lows), indicating consistent selling pressure. Meanwhile, the Commodity Channel Index (CCI) in the overbought area suggests that previous price increases may be limited, opening up the possibility for downward corrections. If the price fails to breach the upper boundary of the channel, Gold may continue its decline with a support target of 2,887.
Technical Reference: sell when below 2,916.00
Potential Stop Loss 1: 2,910.00
Potential Stop Loss 2: 2,916.00
Potential Take Profit 1: 2,892.00
Potential Take Profit 2: 2,887.00


