

The GBPUSD movement on the 1-hour chart continues to exhibit a bullish trend, even though tonight’s session displays a tendency for prices to move in a sideways manner. This consolidation phase is evident from the positions of the ZigZag and Moving Average (MA) indicators, which are situated in the mid-range, suggesting that the market is in a wait-and-see mode regarding its next direction. Following a prior strengthening rally, this sideways phase can be interpreted as a natural pause before a potential continuation of the upcoming trend. The price structure remaining above key support levels indicates that buyers still maintain control, albeit with a slowing momentum.
Regarding momentum, the CCI indicator, now positioned in the oversold territory, provides an initial signal that rebound opportunities are still available. Limited selling pressure may trigger buying reactions shortly, particularly if prices can hold above the current consolidation area. As long as GBPUSD does not breach significant support levels, the bullish bias is expected to persist. This scenario opens up chances for this pair to strengthen again and test nearby resistance levels in the upcoming trading hours.
Recommended

Recommended

Recommended

Recommended
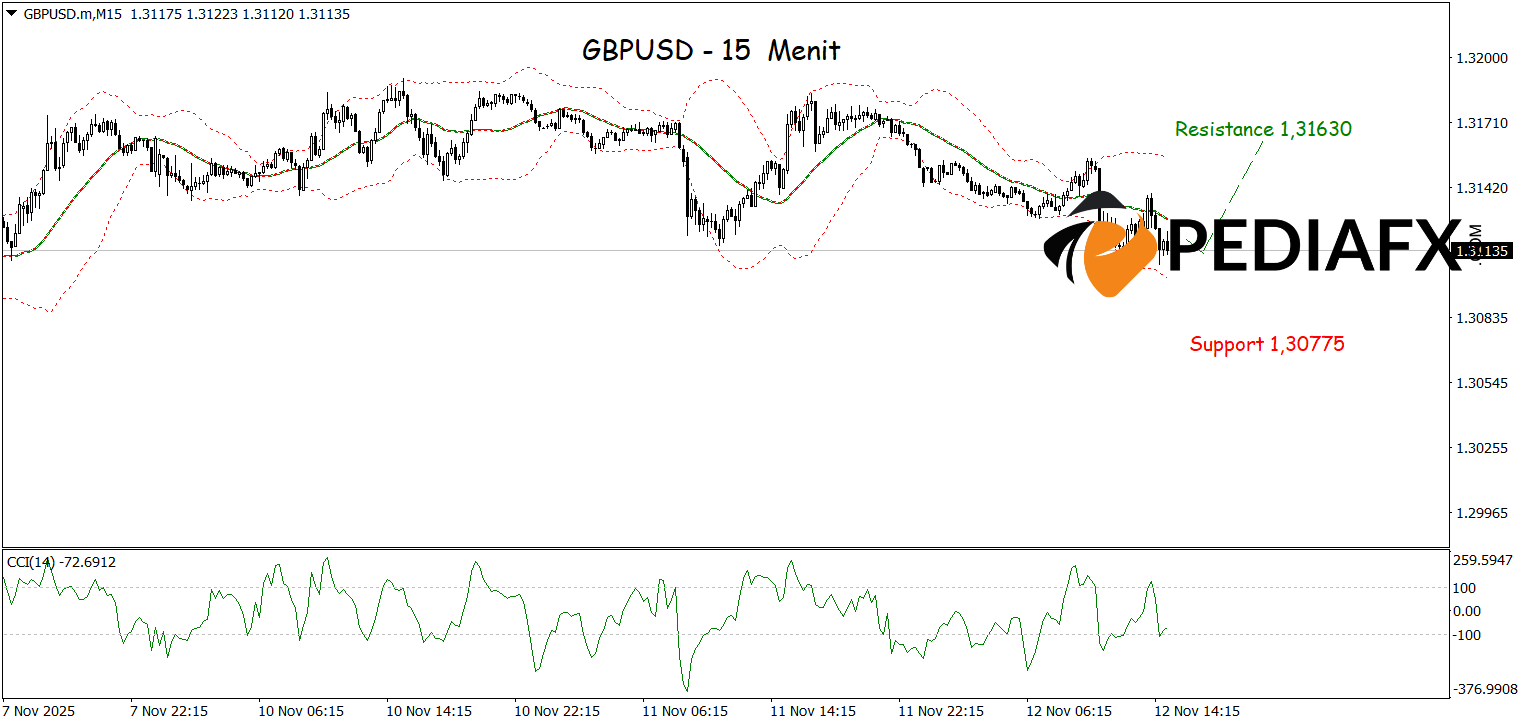
On the 15-minute chart, GBPUSD appears to have potential for strengthening after prices rebounded from the lower zone of the Bollinger Bands (BB). The upward momentum is further supported by the CCI indicator beginning to rise from the oversold area, signifying new buying pressure in the market. The combination of these technical signals reinforces the possibility for GBPUSD to continue its ascent and test the resistance zone around 1.31630.
Technical Reference: Buy while above 1.30775
Potential Take Profit 1: 1.31465
Potential Take Profit 2: 1.31460
Potential Stop Loss 1: 1.30940
Potential Stop Loss 2: 1.30775


