

The GBPUSD pair has experienced selling pressure after breaking below the lower boundary of a bullish channel on the 1-hour time frame, which has disrupted the prior uptrend structure. This breaklow is an early indicator of a potential reversal, especially as it was followed by a sharp decline in the Moving Average (MA), which is now acting as a dynamic resistance.
The downward slope of the MA highlights weakening buying momentum and the dominance of sellers in the short term. As long as the price remains beneath the channel and the MA, the GBPUSD has the potential to continue its decline towards the next support level.
Recommended

Recommended

Recommended

Recommended
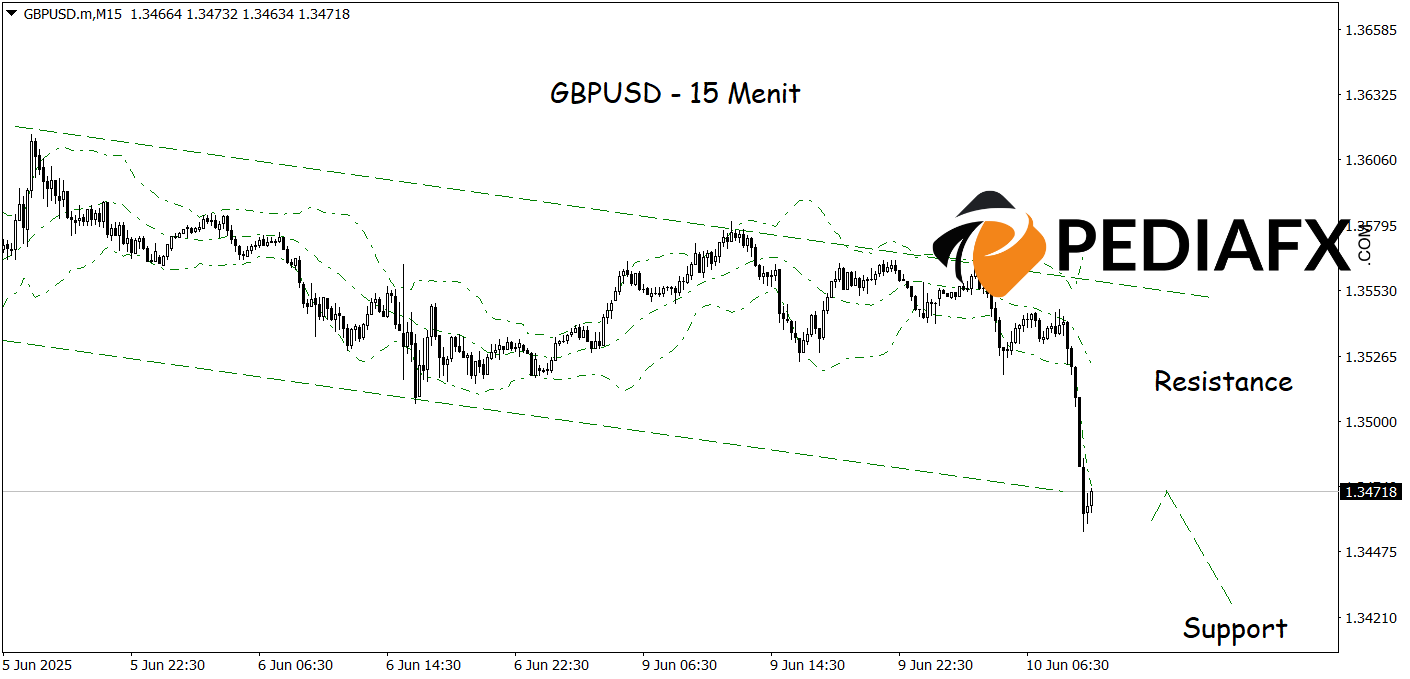
Currently, GBPUSD is moving within a bearish channel on the 15-minute time frame, indicating consistent selling pressure. The price has also breached the lower limit of the Bollinger Bands (BB), suggesting the potential for continued weakness in line with the prevailing short-term downtrend. This breaklow serves as an additional technical signal that bearish momentum is still active, particularly if a significant rebound does not occur soon. As the price remains confined within this channel and fails to breach the dynamic resistance, the possibility of a decline testing 1.34255 remains open.
Technical Reference: sell below 1.35100
Potential Stop Loss 1: 1.34975
Potential Stop Loss 2: 1.35100
Potential Take Profit 1: 1.34360
Potential Take Profit 2: 1.34255


