

The GBPUSD pair continues to trade in a sideways manner on the 1-hour timeframe, caught within a range highlighted by blue shading. The price has made several attempts to breach both support and resistance levels, but has yet to establish a definitive trend. Nonetheless, upon closer inspection, a minor uptrend line appears to be forming, acting as a support for the price movement. This trendline indicates that selling pressure is starting to ease, with buyers gradually regaining control, especially as the European trading session approaches.
In terms of indicators, the CCI shows a significant rebound from the oversold region, signaling an increase in buying interest that could provide additional momentum for GBPUSD. If this momentum persists throughout today’s European session, the possibility of upward movement will become increasingly likely. As long as the price remains above the minor uptrend line and the CCI continues on a positive trajectory, GBPUSD is likely to test the nearest resistance and may even create breakout opportunities if market sentiment allows.
Recommended

Recommended

Recommended

Recommended
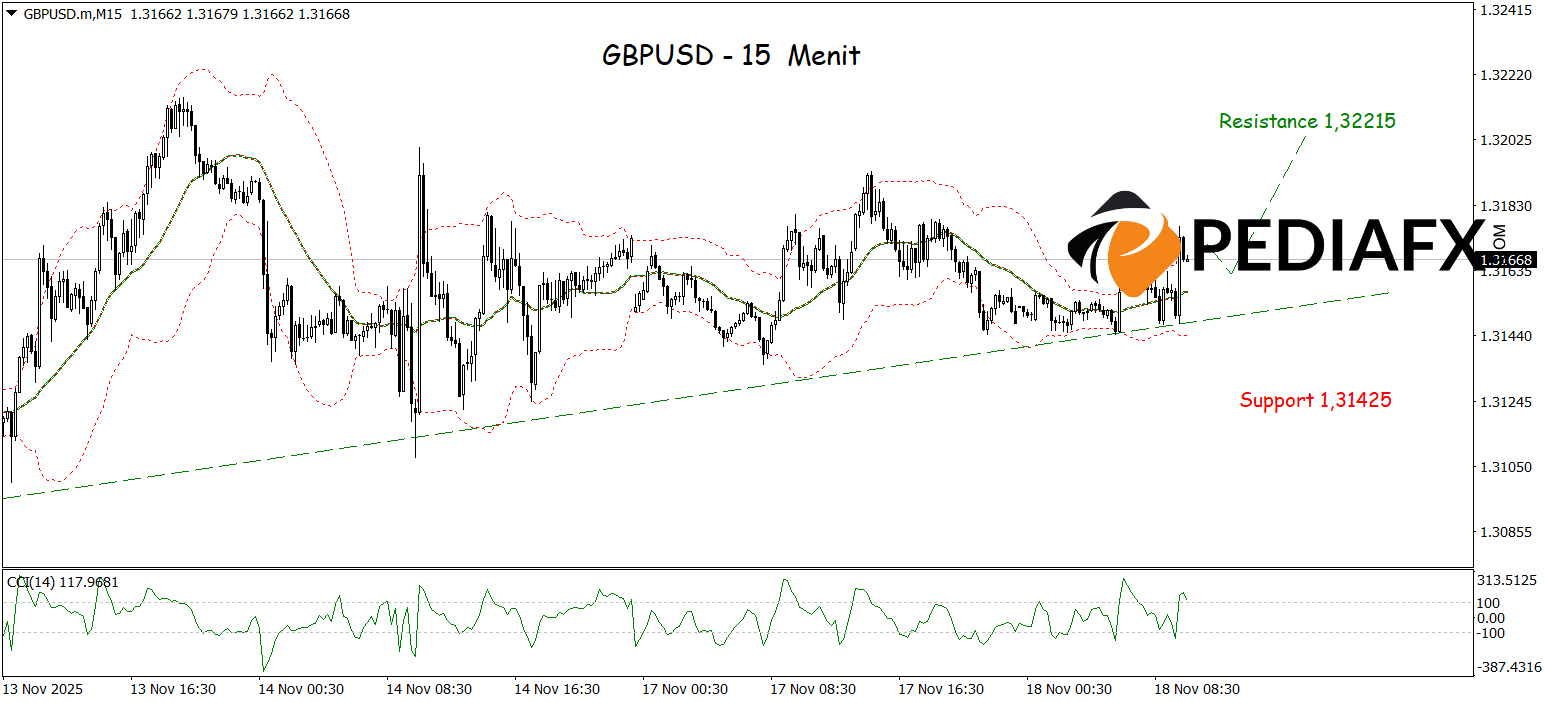
GBPUSD is also starting to exhibit more robust gains after the price broke through the resistance level on the Bollinger Bands, indicating that buying pressure is increasingly dominant in the short term. The upward direction of the Moving Average further reinforces the signal that the short-term trend is shifting towards bullish. Additionally, the sharply rising CCI from the oversold zone further confirms the revival of buying interest. With this combination of technical signals, GBPUSD has a favorable outlook to continue its ascent and test the significant resistance area at 1.32215.
Technical Reference: buy while above 1.31285
Potential Take Profit 1: 1.31920
Potential Take Profit 2: 1.32035
Potential Stop Loss 1: 1.31400
Potential Stop Loss 2: 1.31285


