The GBPUSD pair is currently experiencing strong technical pressure, as it continues to maintain a bearish channel on the 1-hour timeframe. Price movements reflect a consistent downward trend, with the Moving Average (MA) line positioned above the price, acting as a dynamic resistance. This indicates that any attempts at a rebound are likely to be thwarted by the MA area, reinforcing expectations that the downward trend will persist throughout the evening session.
Additionally, the MACD indicator is situated in the negative territory, with the histogram expanding downwards, signaling that bearish momentum remains strong. As long as there isn’t a valid breakout above the resistance channel or a robust reversal signal, the potential for continued decline stays high. Should selling pressure persist, GBPUSD may revisit significant support levels or even establish a new low.
Recommended

Recommended

Recommended

Recommended
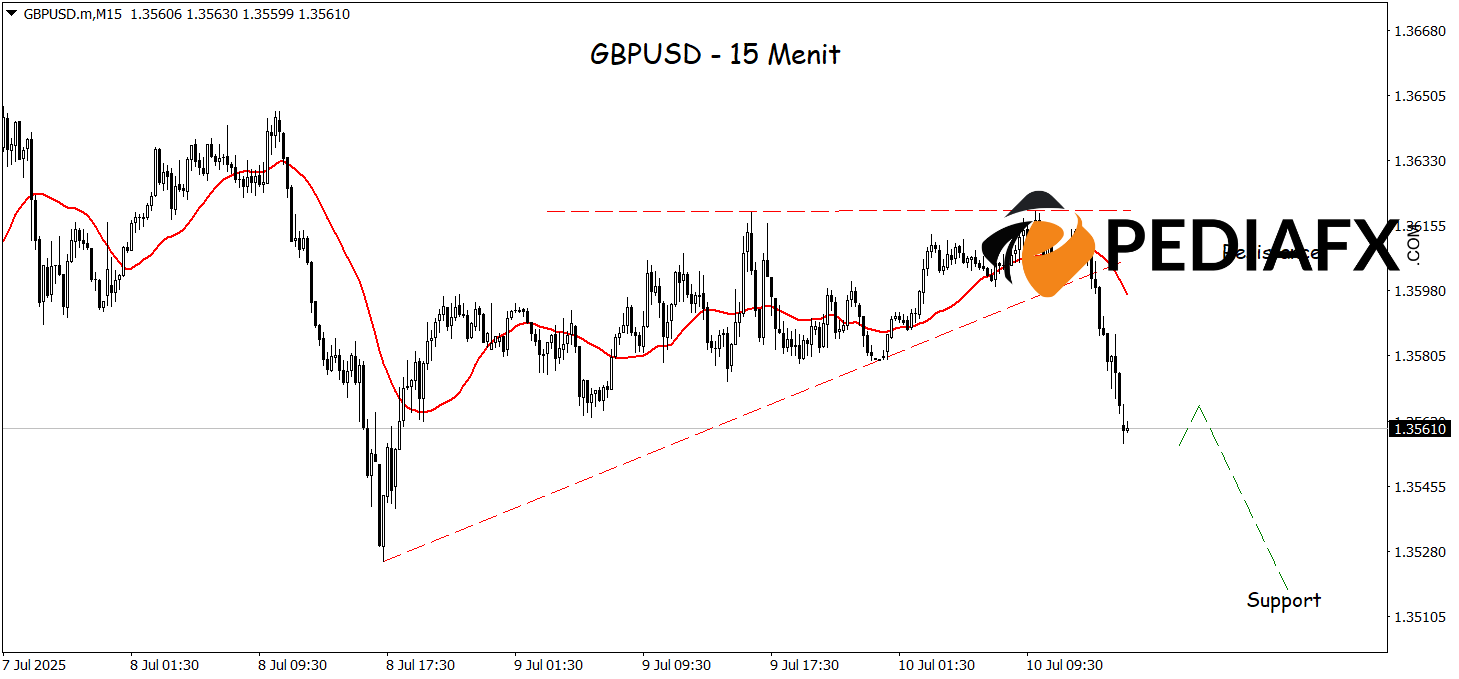
The GBPUSD demonstrates potential for further declines after successfully breaking down from an ascending triangle pattern on the 15-minute timeframe. This breakout serves as an initial signal that buying pressure is diminishing, yielding to seller dominance. This observation is further substantiated by the sharply declining Moving Average (MA) line, indicating strengthening bearish momentum. Provided that prices remain below the breakout area and no valid reversal signals appear, GBPUSD is poised to extend its downward movement towards a support level of 1.35175.
Technical Reference: sell while below 1.36050
Potential Stop Loss 1: 1.35915
Potential Stop Loss 2: 1.36050
Potential Take Profit 1: 1.35350
Potential Take Profit 2: 1.35175