

The Nasdaq chart on a 1-hour time frame demonstrates a consistent upward trend since mid-June 2025, marked by a sequence of Higher Lows (HL) and Higher Highs (HH). Prices are navigating within a parallel upward channel and are currently positioned near the upper boundary of the channel, indicating strong buyer dominance. This bullish market structure is reinforced by price action that consistently achieves rebounds at the channel support level, forming swing lows that are higher than previous ones.
The MACD indicator reflects a histogram still residing in positive territory, although it shows signs of decline, suggesting that the bullish momentum persists, albeit potentially weakening. The signal line also rests above zero, strengthening the upward bias. Meanwhile, the moving average line (likely an EMA) is trending upwards, supporting the price action.
Recommended

Recommended

Recommended

Recommended
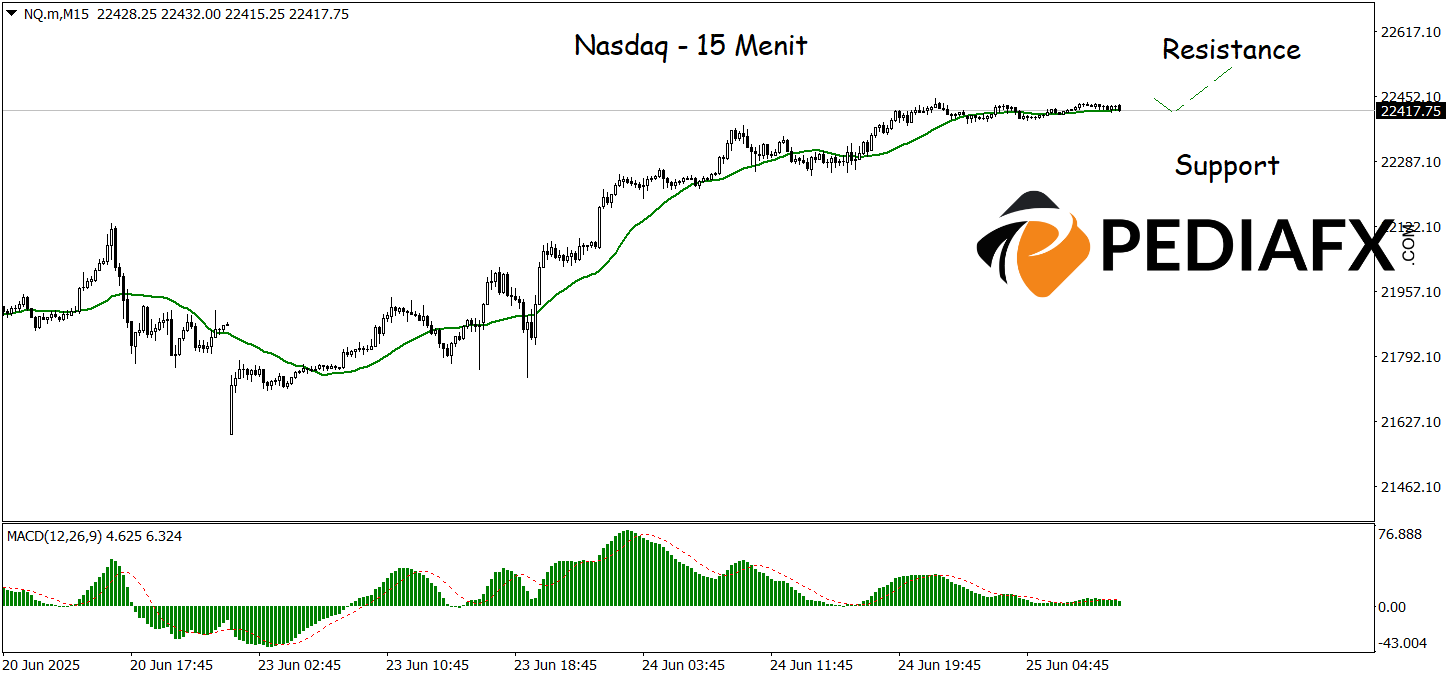
The Nasdaq presents a sustained bullish trend on the 15-minute time frame, with increasingly robust technical signal support. The Moving Average (MA) is on an upward trajectory, reflecting the strengthening of the short-term trend. Additionally, the MACD indicator is also positively moving above the zero line, indicating a growing buying momentum. This combination of indicators provides a confirming signal that the Nasdaq is poised for a continued rise in the near future, with a potential test of the resistance level at 22,530.
Technical Reference: buy as long as it remains above 22,310
Potential Take Profit 1: 22,470
Potential Take Profit 2: 22,530
Potential Stop Loss 1: 22,358
Potential Stop Loss 2: 22,310


