

The GBPUSD pair is experiencing positive movement during the US session tonight after successfully achieving a strong rebound from the previously established lower boundary of the sideways phase. This increase indicates a return of buyer dominance in the market, with buying pressure intensifying as it approaches the upper resistance level from the prior consolidation. The price structure on the 1-hour chart is starting to reveal a reversal pattern, providing initial indications that bullish momentum is currently developing following a period of sideways movement.
Technical support is also bolstering the outlook for this upward trend, as the zigzag indicator displays a sharp rebound from lower areas, while the Moving Average (MA) line begins to trend upwards, confirming a more favorable trend direction. The combination of these two signals indicates that buying pressure is likely to persist in the near term. Should the price break through the upper resistance area, the opportunity for GBPUSD to continue its ascent toward the next resistance level will be significantly enhanced.
Recommended

Recommended

Recommended

Recommended
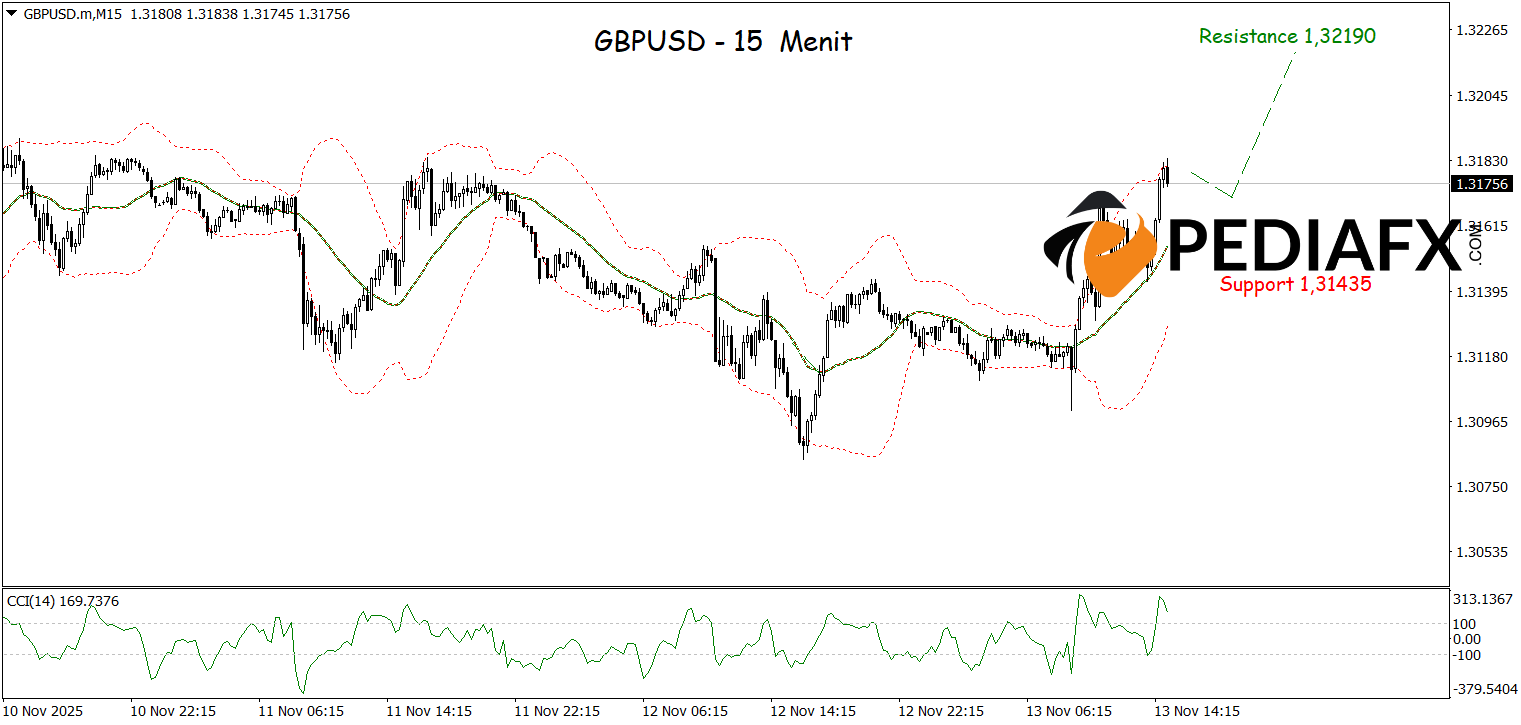
On the 15-minute chart, GBPUSD reveals potential strength after the price has rebounded from the lower area of the Bollinger Bands (BB). The upward momentum is also supported by the CCI indicator, which is beginning to climb out of the oversold territory, signaling fresh buying activity in the market. This combination of technical signals enhances the probability for GBPUSD to continue rising and test the resistance zone around 1.32190.
Technical Reference: buy as long as it’s above 1.31440
Potential Take Profit 1: 1.32050
Potential Take Profit 2: 1.32190
Potential Stop Loss 1: 1.31600
Potential Stop Loss 2: 1.31440


