

The GBPUSD pair is experiencing a positive trend during the US session tonight after a strong rebound from a low area that previously served as the lower boundary of a sideways phase during the European session. This recovery indicates a resurgence of buyer control, with increasing buying pressure as the price approaches the upper resistance area of the consolidation zone. The price structure on the hourly chart is beginning to form a reversal pattern, serving as an initial sign that bullish momentum is developing following a period of lateral movement.
From a technical perspective, the outlook for strengthening is becoming increasingly clear, illustrated by the zigzag indicator showing a sharp rebound from the lower area, indicating an aggressive buyer response to lower price pressures. The Moving Average (MA) line starting to trend upwards provides further confirmation that the trend direction is shifting to the positive side. If the price manages to break through the upper resistance area, the likelihood of GBPUSD continuing to rise towards the next resistance level will increase, supported by strengthening buying momentum.
Recommended

Recommended

Recommended

Recommended
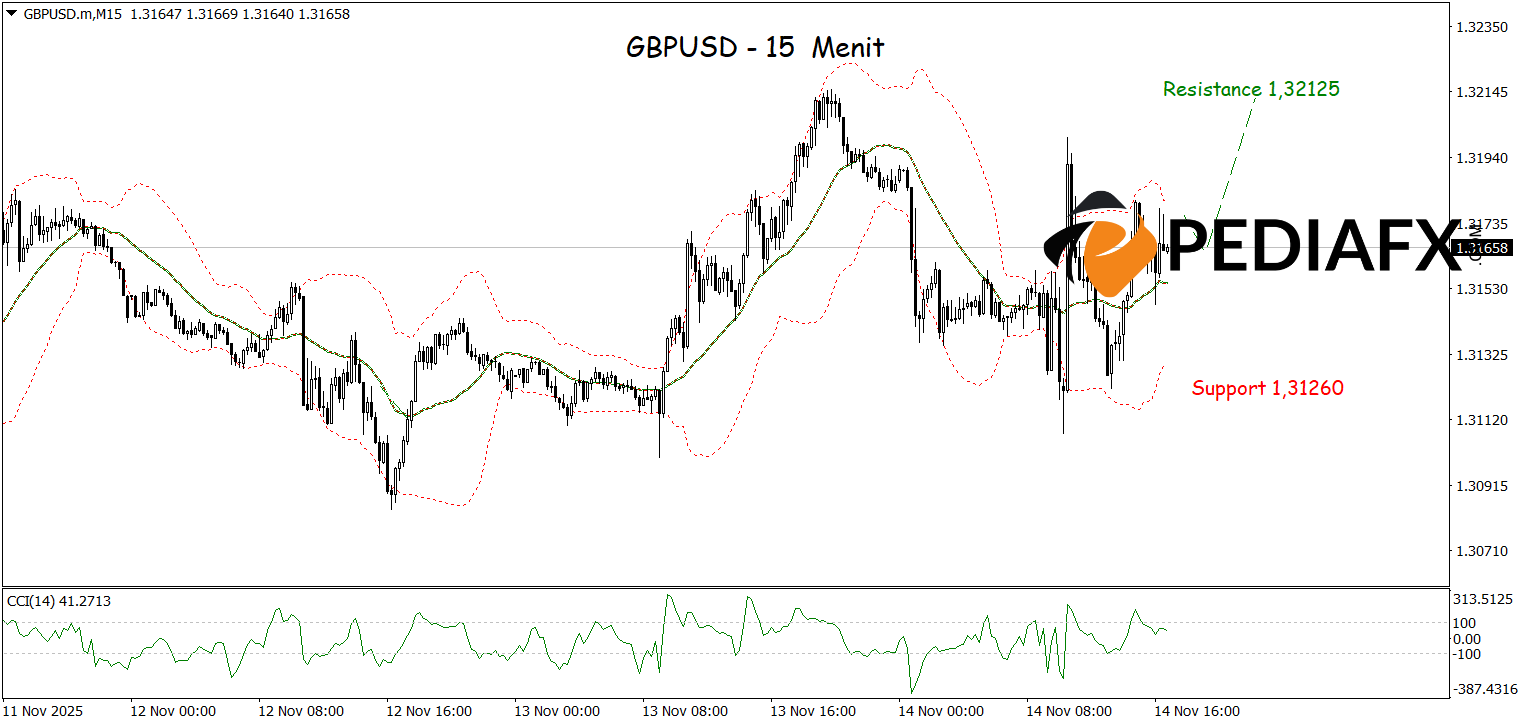
On the 15-minute chart, GBPUSD also demonstrates further upward potential after the price bounced from the lower area of the Bollinger Bands (BB). The momentum signal is further supported by the CCI indicator, which is starting to rise from the oversold area, indicating a new buying impetus in the intraday timeframe. With this harmonious combination of technical signals, GBPUSD has a strong chance to continue strengthening and test significant resistance areas around the level of 1.32125.
Technical Reference: buy while above 1.31260
Potential Take Profit 1: 1.32010
Potential Take Profit 2: 1.32125
Potential Stop Loss 1: 1.31385
Potential Stop Loss 2: 1.31260


