

The USDJPY pair is currently facing resistance at the upper boundary of the Bollinger Bands (BB) on the hourly chart, indicating a significant hurdle for any further price increase. This scenario is supported by the Commodity Channel Index (CCI) being in the overbought territory, signaling that prices may have risen too sharply in a short timeframe. Technical conditions like this often trigger corrections, as market participants tend to lock in profits after a swift rally. Unless the price breaks through the BB upper limit with strong volume, the potential for downward pressure remains high.
In addition, the price movement pattern suggests a weakening trend, accompanied by signs of diminishing buying momentum. Should sell pressures begin to rise, USDJPY could potentially continue its downward trajectory to test the nearest support area, confirming a short-term reversal. The combination of resistance at the upper BB and an overbought CCI presents a strong technical signal that the market may be on the brink of a corrective phase. Traders should keep an eye out for potential sell entries, especially if additional confirmation arises from candlestick patterns or other supporting indicators.
Recommended

Recommended

Recommended

Recommended
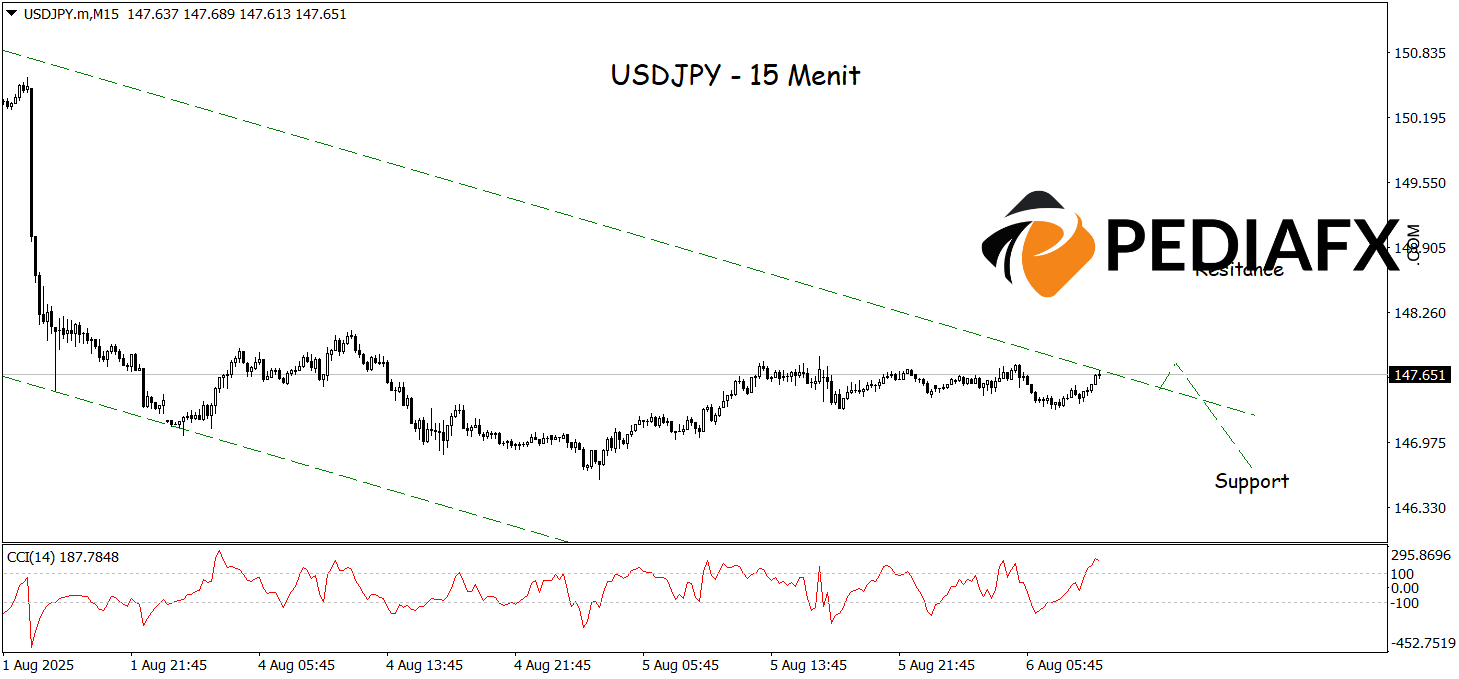
A bearish channel is beginning to form on the 15-minute chart, indicating potential continued selling pressure on USDJPY. The CCI’s downturn from the overbought area further strengthens the signal of weakening buying momentum, opening the door for prices to decline. With the combination of a downward channel pattern and technical signals leaning toward the downside, USDJPY is poised to continue its decline toward the support level of 146.700.
Technical Reference: sell below 148.520
Potential Stop Loss 1: 148.195
Potential Stop Loss 2: 148.520
Potential Take Profit 1: 147.010
Potential Take Profit 2: 146.700


