

The USDJPY pair has exhibited a notable change in its structure after the price broke below the bullish channel, suggesting that selling pressure is beginning to dominate the movements on the 1-hour timeframe. This breakout was further confirmed by a pullback that followed the breach, where the price attempted to retest the broken area but failed to reclaim it. Such a pattern typically serves as a strong indicator that the market is preparing for further declines since buyers are unable to regain control from the sellers.
Moreover, technical indicators also align with the bearish scenario. The ZigZag indicator is forming a bearish structure, which is indicative of lower lows and lower highs beginning to appear. In terms of momentum, the Commodity Channel Index (CCI) is within the oversold territory, highlighting that bearish pressure remains dominant, although there may be a slight potential for a minor retracement. With the combination of the break below, valid pullback, descending ZigZag, and negative momentum from CCI, USDJPY has a strong likelihood of continuing its downward trend in subsequent sessions.
Recommended

Recommended

Recommended

Recommended
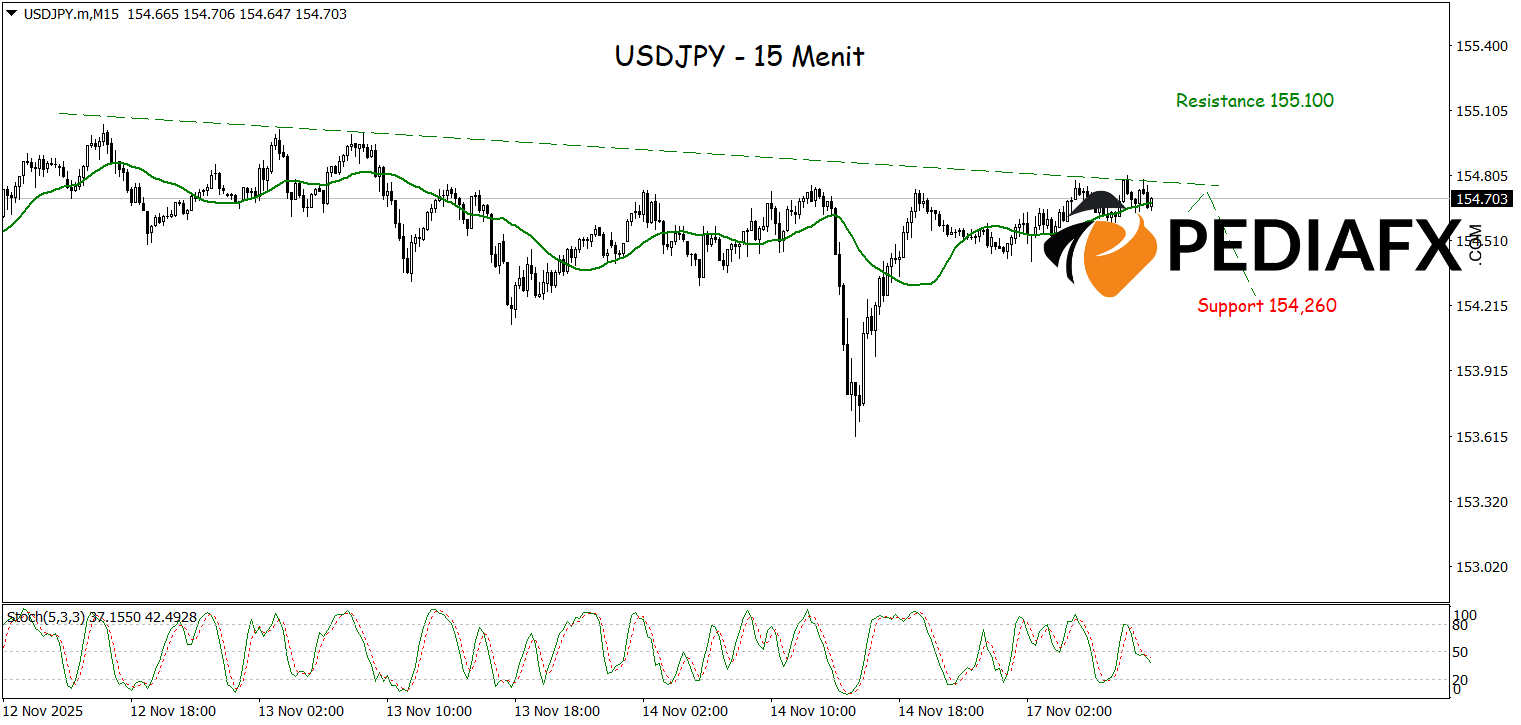
A bearish trendline formed on the 15-minute timeframe shows that selling pressure continues to direct the USDJPY movements. This pressure is further illustrated as the price begins to cross below the moving average (MA) line, signifying a continuation of the weakening momentum. Additionally, the Stochastic indicator is currently in the overbought range, signaling an increasing likelihood of a downward reversal. With the combination of a weakening trend, a breached MA, and Stochastic poised to drop from extreme levels, USDJPY is likely to continue its decline, testing a significant support level at 154.250 in the near future.
Technical Reference: Sell while below 155,100
Potential Take Profit 1: 154,955
Potential Take Profit 2: 155,100
Potential Stop Loss 1: 154,435
Potential Stop Loss 2: 154,260


