

The Nasdaq index is currently indicating a potential reversal in direction as signs of a head and shoulders pattern emerge within the one-hour time frame. This pattern is well-recognized as one of the most reliable technical signals for detecting shifts in trend from bullish to bearish. If this pattern gets confirmed with a breakdown of the neckline, the likelihood of a price correction will significantly increase. This signal is further supported by the Moving Average (MA) line starting to flatten and tilt downwards, suggesting a weakening buying momentum in the short term.
Additionally, the Zigzag indicator also corroborates the price weakening structure by forming increasingly lower peaks. The combination of signals from MA and Zigzag enhances the developing correction potential. Should selling pressure continue to rise and the Nasdaq fail to maintain its nearest technical support, the scenario of a trend reversal towards bearish could materialize. This situation is crucial for investors and traders to monitor, especially ahead of the release of major economic data or monetary policy statements that could speed up this reversal.
Recommended

Recommended

Recommended

Recommended
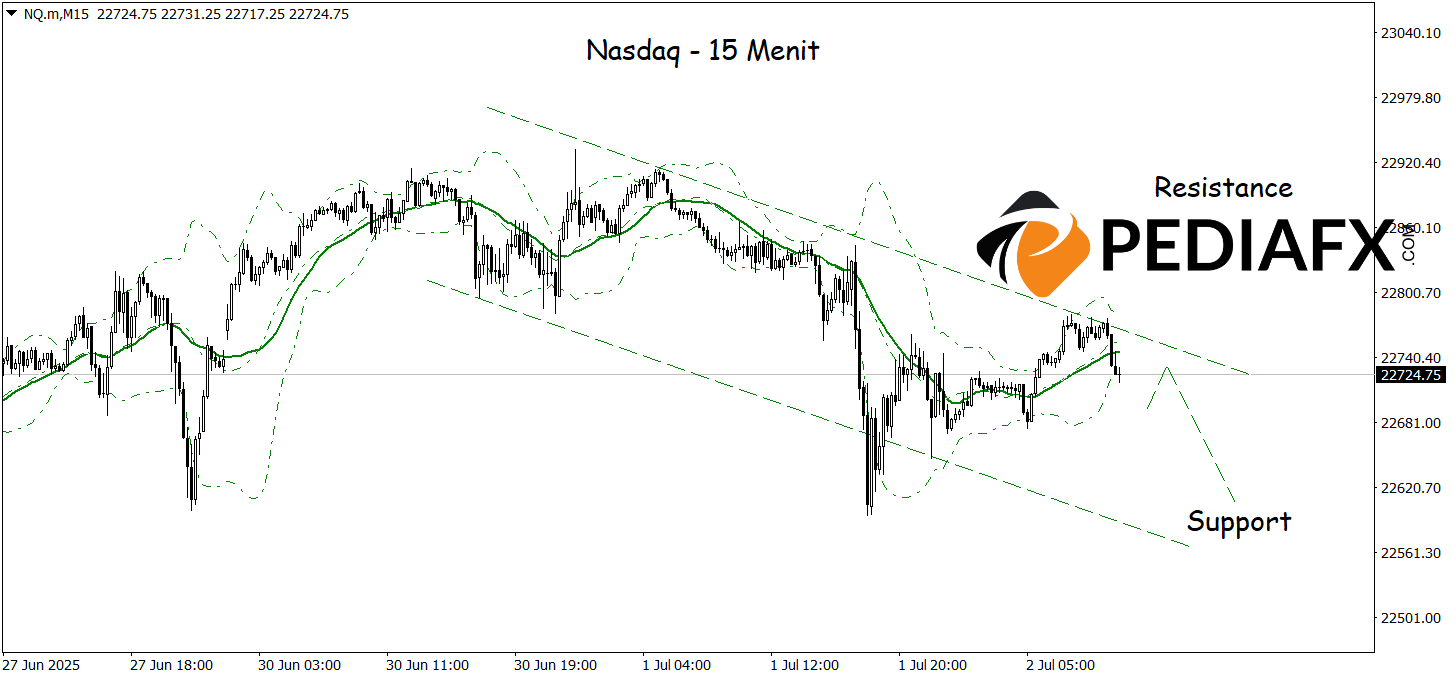
On the 15-minute time frame, a bearish channel is beginning to take shape in the Nasdaq index movements, indicating that selling pressure is consistently rising in the short term. The price breaching the lower band of the Bollinger Bands reinforces the signal of weakening, showcasing that the downward momentum is still ongoing. If there is no strong bounce from the nearest support area, the Nasdaq may continue to decline towards testing the 22,600 level.
Technical Reference: sell while below 22,885
Potential Stop Loss 1: 22,855
Potential Stop Loss 2: 22,885
Potential Take Profit 1: 22,640
Potential Take Profit 2: 22,600


