

During the US session, the performance of the Nasdaq index on the 1-hour timeframe reveals a convincing upward trend. The price structure displays a pattern of Higher High (HH) and Higher Low (HL) consistently forming, indicating a strengthening bullish trend. After bouncing off the lower line of the rising channel, prices have continued to ascend, successfully marking a new HH. This technical formation reflects the increasing dominance of buyers, especially following the emergence of the last HL, which acts as a support point for further upward movement.
Technical signals also confirm this trend direction. The MACD indicator shows a histogram strengthening above the zero line, indicating an increase in buying momentum. Meanwhile, the Moving Average line is starting to turn upwards, supporting the price continuity within the bullish channel. As long as the HH-HL structure remains intact and prices do not breach the midpoint of the channel downwards, the opportunities for Nasdaq to continue its upward trend remain open with the potential for significant movements.
Recommended

Recommended

Recommended

Recommended
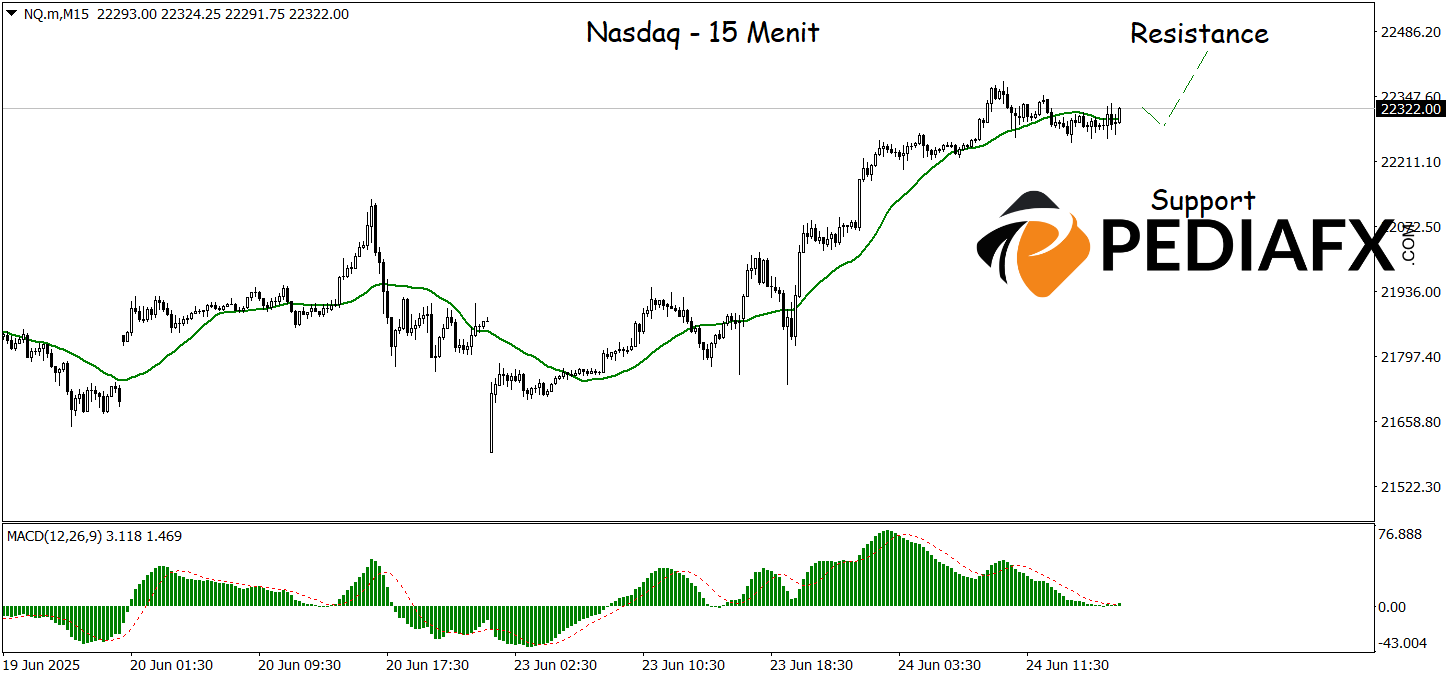
The Nasdaq exhibits potential for continued upward movement on the 15-minute timeframe, supported by increasingly solid technical signals. The Moving Average (MA) is sharply rising, reflecting the strength of the short-term trend. Concurrently, the MACD indicator is also positively positioned above the zero line, indicating an ongoing buying momentum. The combination of these two indicators provides confirmatory signals that the Nasdaq is poised for further gains in the near future, with the potential to test the resistance level of 22,440.
Technical Reference: buy as long as above 22,157
Potential Take Profit 1: 22,393
Potential Take Profit 2: 22,440
Potential Stop Loss 1: 22,207
Potential Stop Loss 2: 22,157


