

The Nasdaq index, as illustrated on the 1-hour chart, continues to display a valid upward trend structure characterized by a series of Higher Highs (HH) and Higher Lows (HL) that are forming consistently. Prices are persistently moving within a rising channel, delineated by a green line, highlighting the prevailing bullish trend. Any corrections that have occurred thus far have found support at the lower channel area and have subsequently strengthened, indicative of robust buying responses. Despite experiencing sharp downward pressure at times, prices have managed to hold firm and rebound above the lower channel line, reinforcing the latest HL position.
Meanwhile, the Moving Average indicator (red line) displays an overall upward slope, suggesting that the short-term trend remains positive. Although the MACD is still in negative territory, its histogram is starting to show signs of recovering momentum. This opens avenues for the Nasdaq to resume its ascent, provided that prices do not breach the channel’s support. Technically speaking, as long as the HH-HL structure is maintained, the potential for a further rally remains viable, with the next resistance level positioned at the upper area of the channel.
Recommended

Recommended

Recommended

Recommended
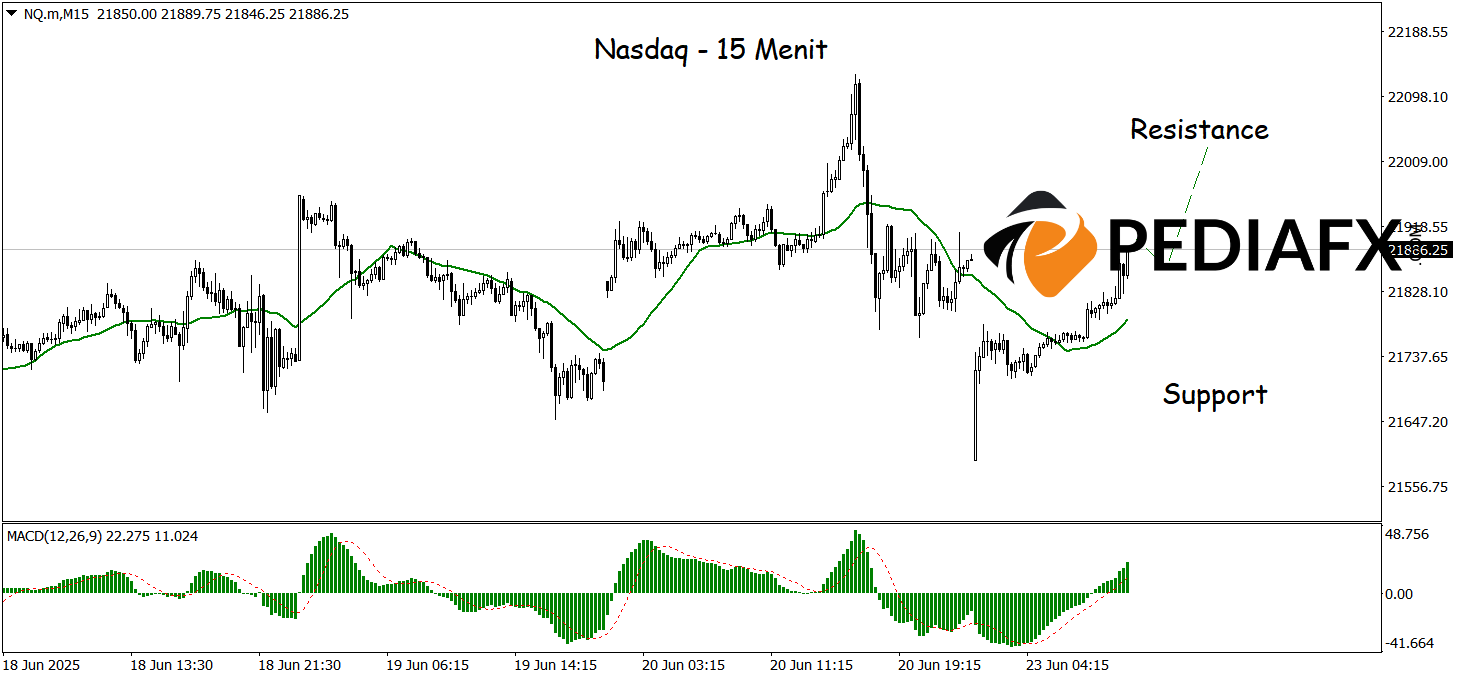
The MA and MACD indicators on the 15-minute time frame continue to provide a cohesive signal supporting the Nasdaq’s upward trend. The price movement remaining above the Moving Average line indicates buyer dominance in the short term, while the MACD being in positive territory reflects an active bullish momentum. As long as both indicators move in the same direction, the chances for a sustained rally remain intact, with Nasdaq potentially testing the nearest resistance level of 22,028.
Technical References: buy as long as above 21,735
Potential Take Profit 1: 21,985
Potential Take Profit 2: 22,028
Potential Stop Loss 1: 21,782
Potential Stop Loss 2: 21,735


