

The movement of the Nasdaq within a 1-hour time frame indicates a strong inclination to remain in an upward channel (bullish channel) that has been established since late May 2025. The price pattern continues to reflect a Higher High (HH) and Higher Low (HL) formation, signaling that buying pressure remains dominant overall. Currently, the price is testing the formation of a new HL around the midpoint of the channel, reinforcing the persistence of the upward trend.
Meanwhile, the CCI indicator indicates a position close to the oversold zone, providing a signal for a potential rebound in the near future. As long as the price remains within the bullish channel and there are no breaches of the HL structure, the outlook for the Nasdaq moving towards the highest resistance within that channel remains highly favorable.
Recommended

Recommended

Recommended

Recommended
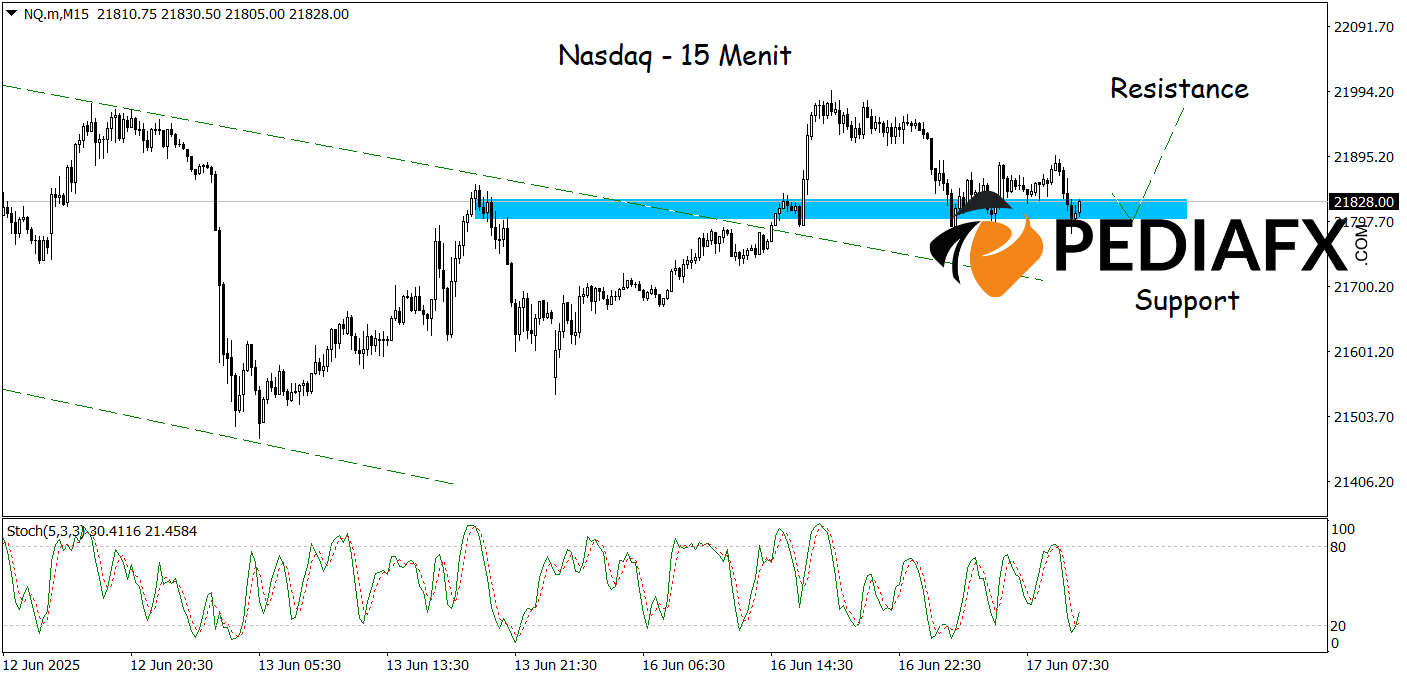
On the 15-minute time frame, the Nasdaq displays potential for a rebound after the price revisits a support zone that also represents a previous breakout area. This level has proven to be a crucial boundary that has impeded selling pressure over the last few hours. Signals from the Stochastic indicator, approaching the oversold region, further enhance the likelihood of price bouncing from this zone. If it manages to sustain and bounce back from the aforementioned blue support, the Nasdaq is likely to retest the nearest resistance around 22,000.
Technical Reference: buy while above 21,700
Potential Take Profit 1: 21,952
Potential Take Profit 2: 22,000
Potential Stop Loss 1: 21,748
Potential Stop Loss 2: 21,700


