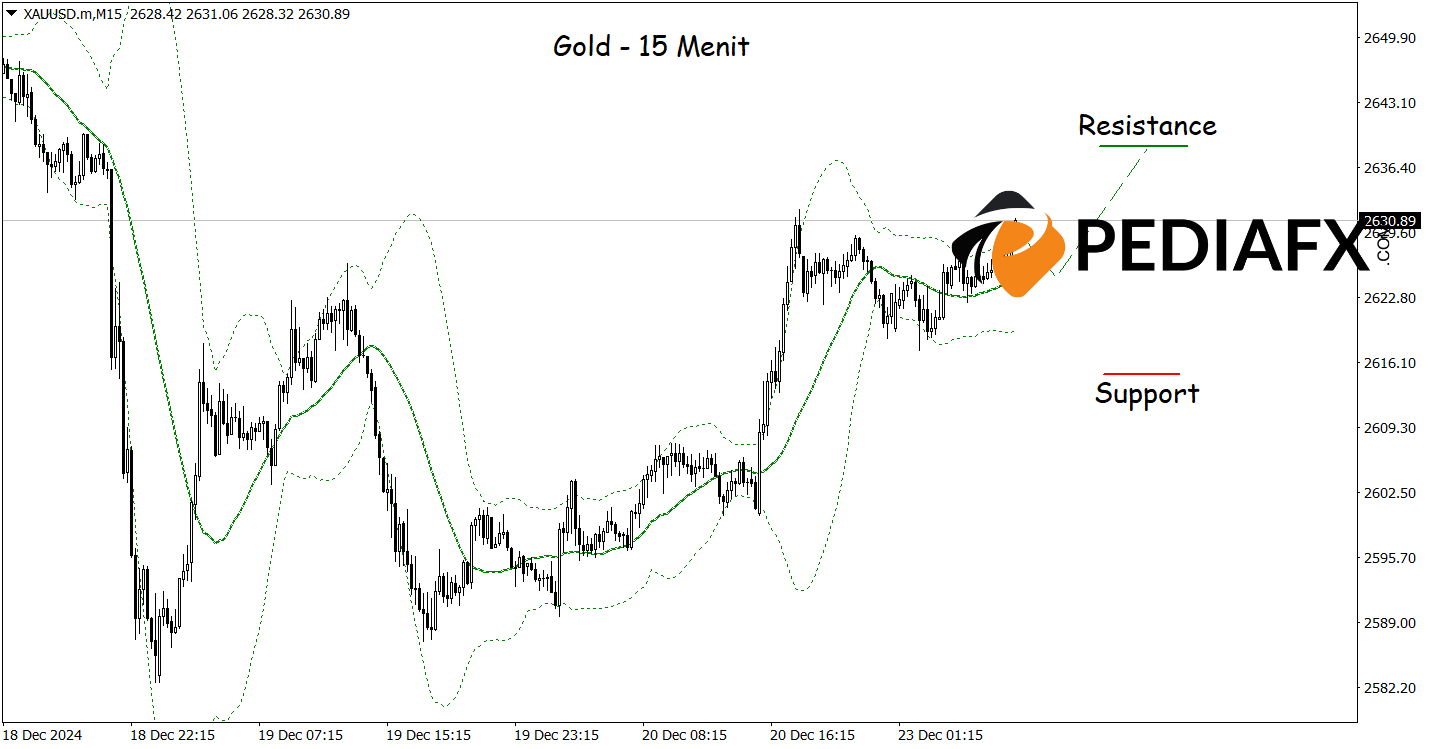
Gold is displaying significant signs of resurgence after successfully breaking through a bearish channel. In recent trading sessions, the price of Gold has surpassed previous limits that hindered its upward movement, indicating a strong potential for bullish trends.
Technical analysis reveals that the Moving Average (MA) has emitted positive signals, with the short-term MA crossing above the long-term MA. This is often regarded as a bullish signal, suggesting that the upward trend may persist. Furthermore, the MACD (Moving Average Convergence Divergence) indicator also indicates strengthening momentum, as the MACD line moves above the signal line, adding confidence that Gold prices are likely to continue rising.
Recommended
Recommended
Recommended
Recommended

In the 15-minute chart above, Gold continues to exhibit bullish potential as the upward trends indicated by the Bollinger Bands may provide support for Gold. Should the aforementioned scenario align, there is potential for Gold to rise towards the resistance level of $2,638.00 per troy ounce.
Technical Reference: buy as long as it’s above 2,638.00
Potential Take Profit 1: 2,634.00
Potential Take Profit 2: 2,638.00
Potential Stop Loss 1: 2,619.00
Potential Stop Loss 2: 2,614.00


