On the hourly chart, the price of Gold is seen moving below the Trendline that has been established since December 12th. As long as it remains beneath this Trendline, Gold is likely to continue its downward trajectory.
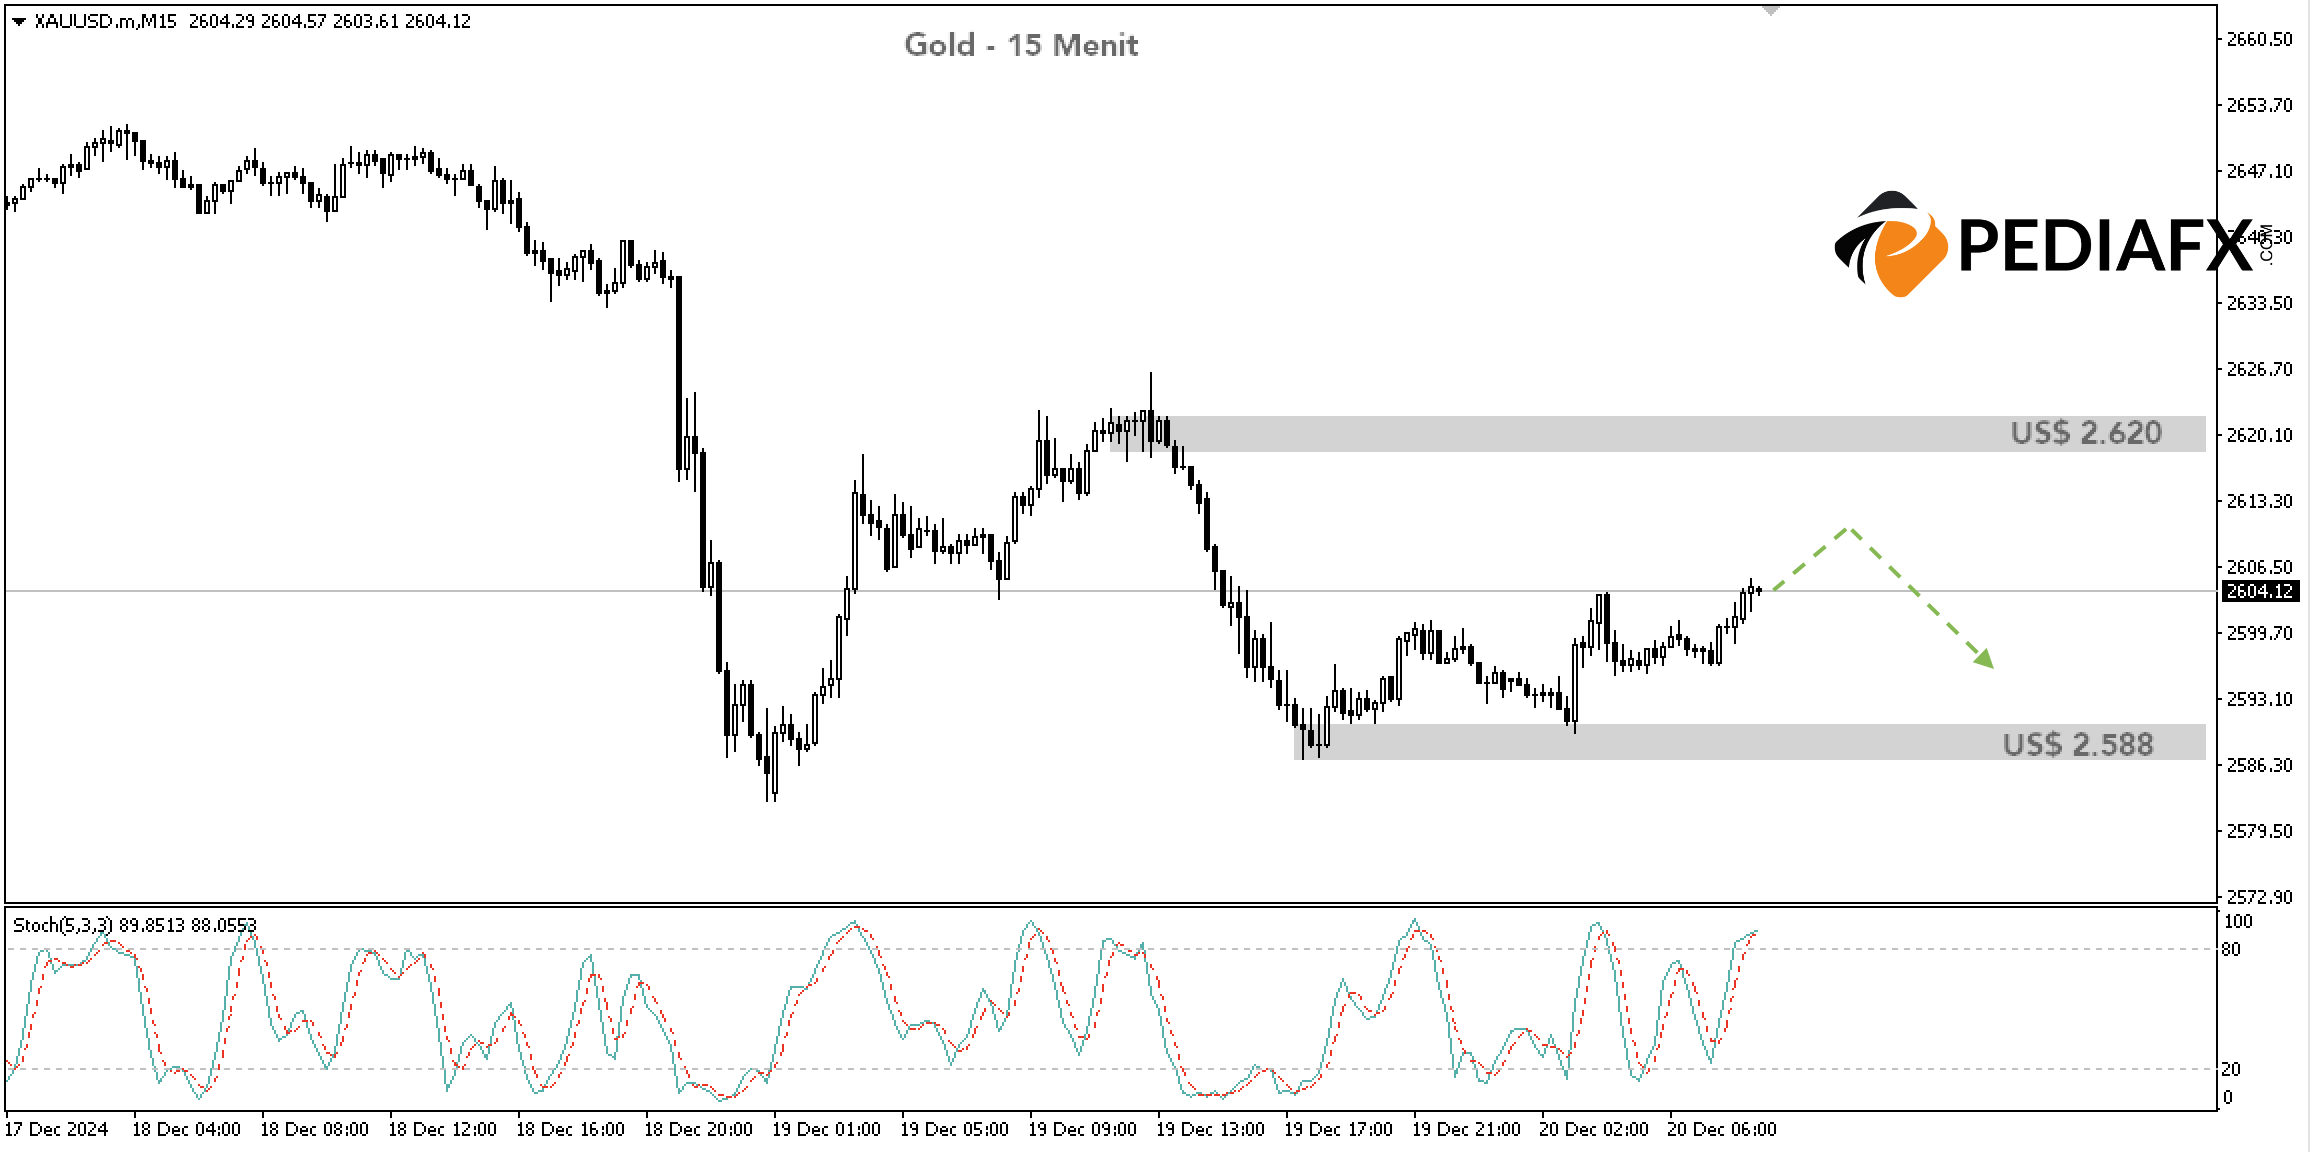
The area around US$ 2,620 per troy ounce has become a strong resistance level. Looking back, this level has previously acted as support that prevented further declines in Gold’s price. Since being breached last Wednesday, Gold has struggled to reestablish itself above this level, making it a strong support become resistance point.
Recommended
Recommended
Recommended
Recommended
The Stochastic indicator is also rising and nearing the overbought territory. If it continues to approach this resistance level, the Stochastic will hit the overbought zone, increasing the likelihood of a reversal.

On the 15-minute chart, the Stochastic has already entered the overbought zone, further amplifying the potential for a decline.
As long as Gold stays below US$ 2,620, there is potential for it to drop to around US$ 2,588. If this level is breached, Gold could potentially fall to US$ 2,580.
Technical References: sell while under US$ 2,620
Potential Take Profit 1: US$ 2,588
Potential Take Profit 2: US$ 2,580
Potential Stop Loss 1: US$ 2,620
Potential Stop Loss 2: US$ 2,629


