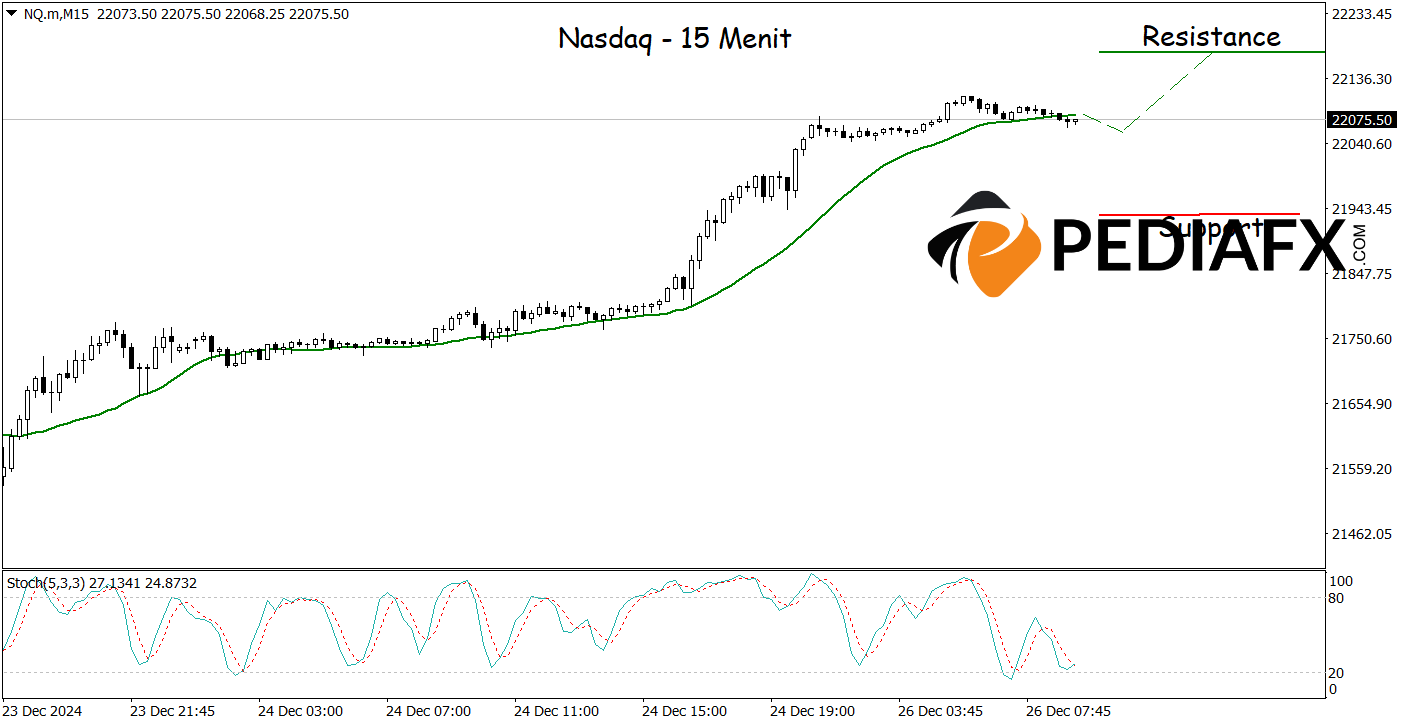
The Nasdaq index appears poised to continue its upward trajectory, buoyed by encouraging signals from the 24-period Moving Average (MA) and the Moving Average Convergence Divergence (MACD) indicator. Recent trading sessions have seen these indicators provide robust evidence that bullish momentum is strengthening, which creates a potential opportunity for investors to engage in buying positions.
The 24-period MA indicates that the current price is situated above the moving average line, often signalling that an upward trend is in play. When prices are trading above the MA, it reflects a generally positive market sentiment, leading investors to consider more buying options.
Recommended
Recommended
Recommended
Recommended

Similarly, an analysis of the 15-minute chart shows that the Nasdaq is also signaling a buying opportunity, particularly as the Stochastic oscillator is moving out of oversold territory, which further enhances the likelihood of a price increase. If the scenario unfolds as anticipated, the Nasdaq could rise to challenge the resistance level of 22,170.
Technical Reference: Buy if above 21,935
Potential Take Profit Target 1: 22,110
Potential Take Profit Target 2: 22,170
Potential Stop Loss Level 1: 21,990
Potential Stop Loss Level 2: 21,935


