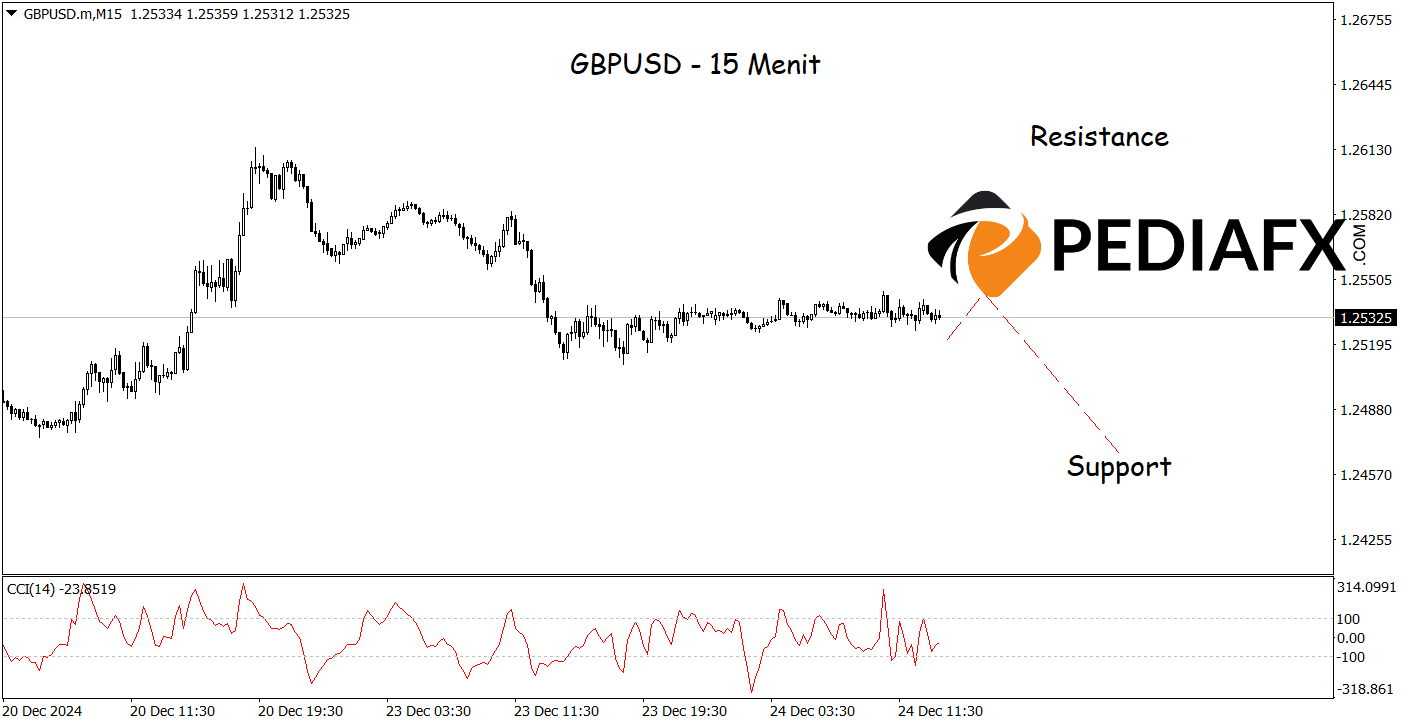
The GBPUSD currency pair is currently experiencing intensified selling pressure after successfully breaking through a key support level. This bearish outlook is further validated by signals from the Moving Average (MA) and the MACD (Moving Average Convergence Divergence), both of which indicate the potential for continued downward movement.
The Moving Average indicates that prices are residing below the short-term moving average line, reflecting the dominance of sellers in the market. Meanwhile, the MACD confirms the bearish momentum, with the MACD line trading below the signal line and the histogram showing an increasing depth in the negative territory.
Recommended
Recommended
Recommended
Recommended

In alignment with the hourly chart analysis above, on the 15-minute chart, GBPUSD also presents bearish opportunities as the Stochastic CCI indicator showed a condition of Strong Bearish, signaling a momentum for decline. GBPUSD has a chance to further drop to the support level at 1.24640.
Technical Reference: Sell while below 1.26130
Potential Stop Loss 1: 1.25860
Potential Stop Loss 2: 1.26130
Potential Take Profit 1: 1.24860
Potential Take Profit 2: 1.24640


