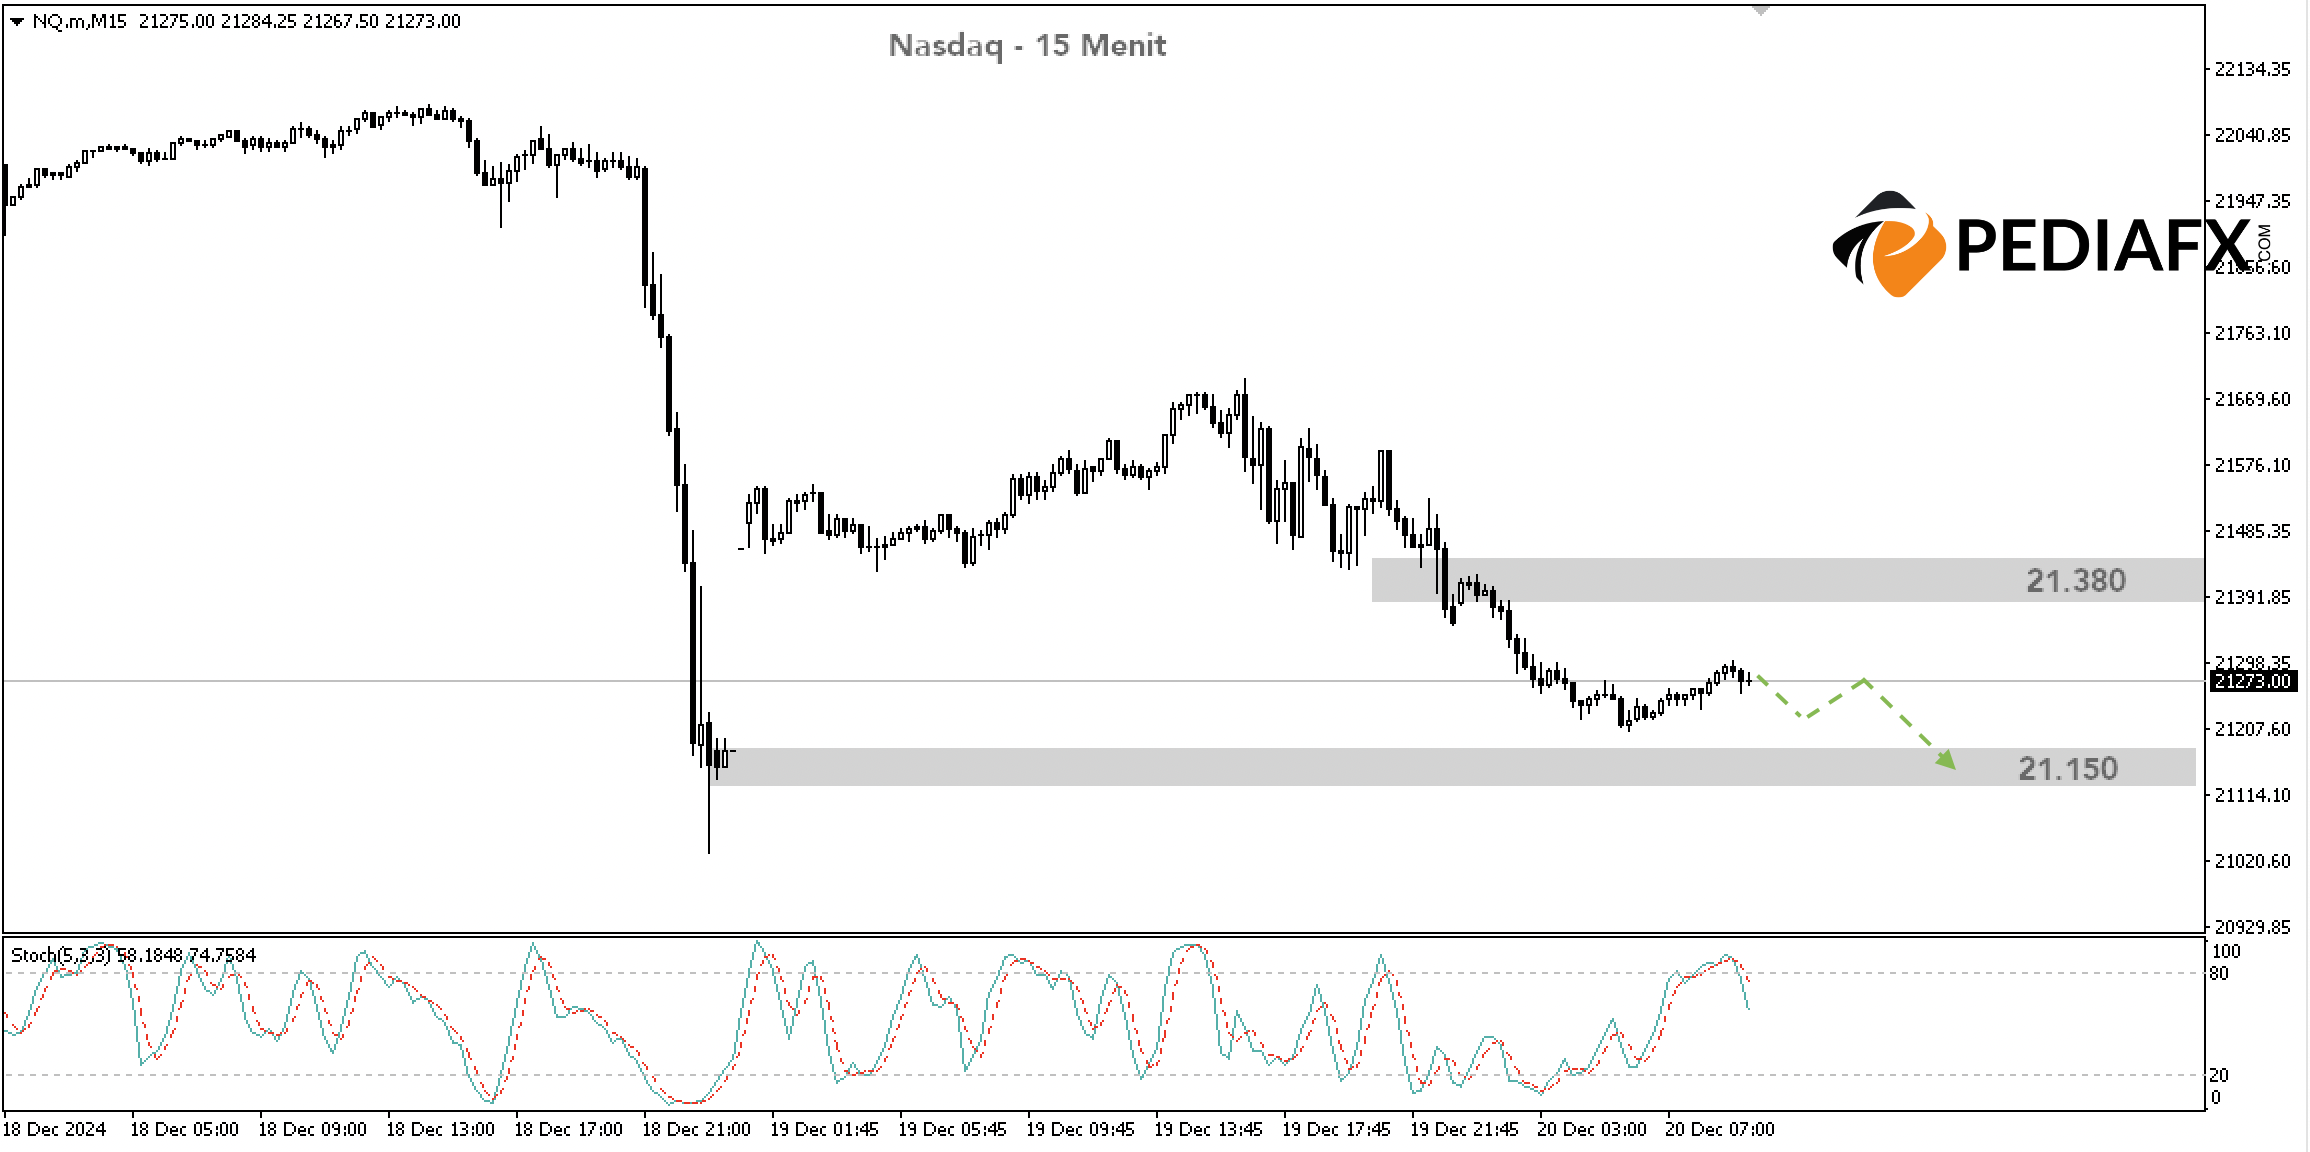
On the hourly chart, the Nasdaq remains below the 20-period and 50-period Moving Averages which have intersected previously. Additionally, the Stochastic indicator is showing upward movement and is approaching a strong resistance level around 21,380.
Thus, if the Stochastic continues to rise and nears this resistance, it indicates a potential entry into overbought territory. This scenario suggests a likelihood of a downturn.
مُستَحسَن
مُستَحسَن
مُستَحسَن
مُستَحسَن

On the 15-minute chart, the Stochastic has already reached overbought levels, increasing the likelihood of a decline. As long as it stays below 21,380, there is potential for the Nasdaq to drop to 21,150.
المراجع الفنية: يبيع while under 21,380
Potential Take Profit 1: 21,150
Potential Take Profit 2: 21,000
Potential Stop Loss 1: 21,380
Potential Stop Loss 2: 21,500


